Swedish vs Immigrants from Mexico Median Male Earnings
COMPARE
Swedish
Immigrants from Mexico
Median Male Earnings
Median Male Earnings Comparison
Swedes
Immigrants from Mexico
$57,445
MEDIAN MALE EARNINGS
94.8/ 100
METRIC RATING
115th/ 347
METRIC RANK
$44,960
MEDIAN MALE EARNINGS
0.0/ 100
METRIC RATING
330th/ 347
METRIC RANK
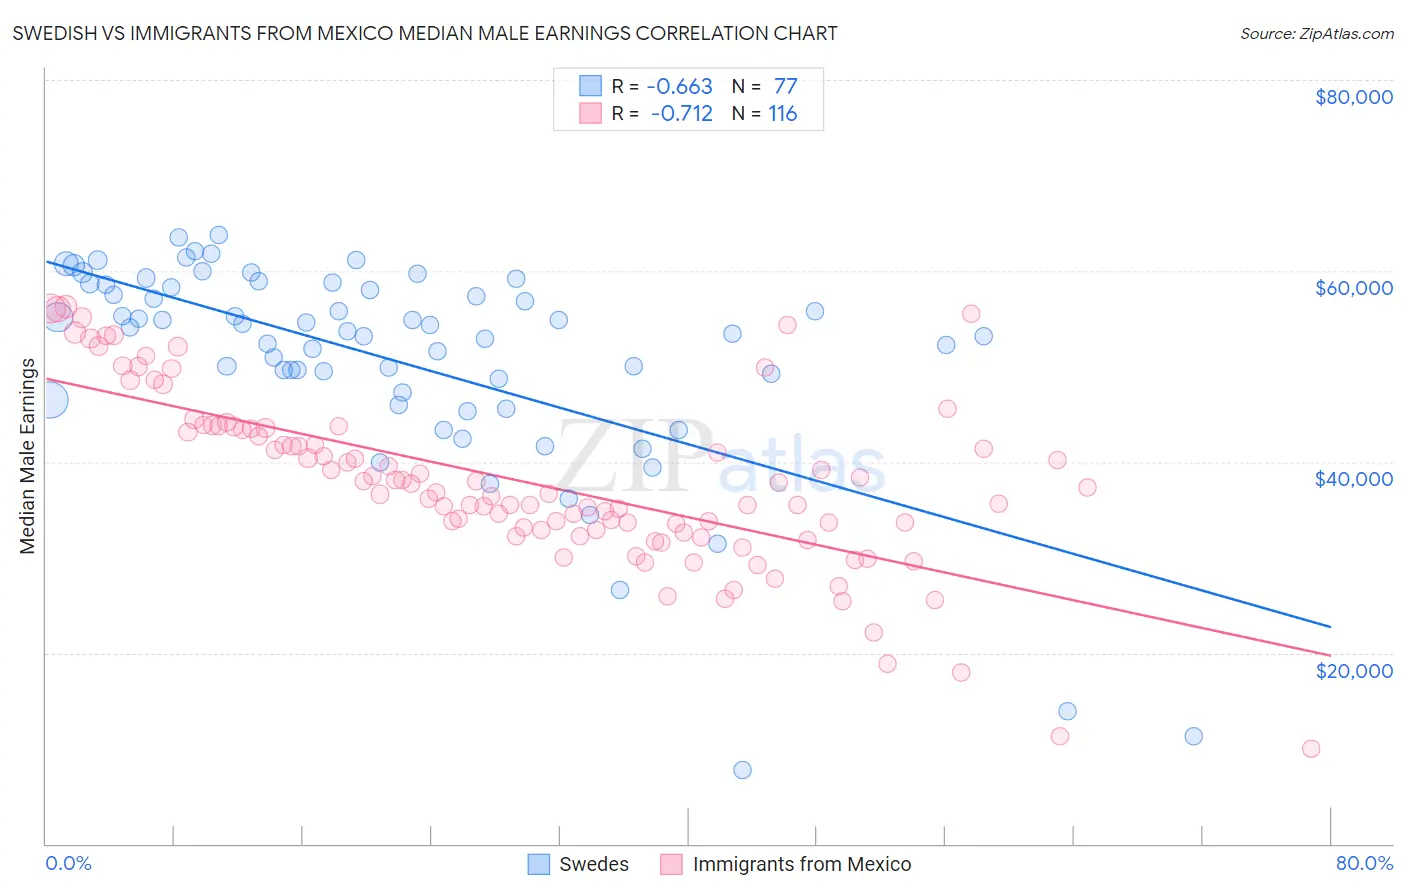
Swedish vs Immigrants from Mexico Median Male Earnings Correlation Chart
The statistical analysis conducted on geographies consisting of 538,411,583 people shows a significant negative correlation between the proportion of Swedes and median male earnings in the United States with a correlation coefficient (R) of -0.663 and weighted average of $57,445. Similarly, the statistical analysis conducted on geographies consisting of 513,109,400 people shows a strong negative correlation between the proportion of Immigrants from Mexico and median male earnings in the United States with a correlation coefficient (R) of -0.712 and weighted average of $44,960, a difference of 27.8%.
Median Male Earnings Correlation Summary
| Measurement | Swedish | Immigrants from Mexico |
| Minimum | $7,750 | $9,917 |
| Maximum | $63,730 | $56,239 |
| Range | $55,980 | $46,322 |
| Mean | $50,664 | $37,983 |
| Median | $53,721 | $37,054 |
| Interquartile 25% (IQ1) | $46,926 | $32,850 |
| Interquartile 75% (IQ3) | $58,399 | $43,508 |
| Interquartile Range (IQR) | $11,473 | $10,658 |
| Standard Deviation (Sample) | $11,170 | $9,092 |
| Standard Deviation (Population) | $11,097 | $9,053 |
Similar Demographics by Median Male Earnings
Demographics Similar to Swedes by Median Male Earnings
In terms of median male earnings, the demographic groups most similar to Swedes are Lebanese ($57,409, a difference of 0.060%), Immigrants from Zimbabwe ($57,352, a difference of 0.16%), Immigrants from Kuwait ($57,562, a difference of 0.20%), Carpatho Rusyn ($57,572, a difference of 0.22%), and Immigrants from Afghanistan ($57,582, a difference of 0.24%).
| Demographics | Rating | Rank | Median Male Earnings |
| Immigrants | Uzbekistan | 96.7 /100 | #108 | Exceptional $57,941 |
| British | 96.5 /100 | #109 | Exceptional $57,890 |
| Palestinians | 96.2 /100 | #110 | Exceptional $57,778 |
| Europeans | 95.6 /100 | #111 | Exceptional $57,637 |
| Immigrants | Afghanistan | 95.4 /100 | #112 | Exceptional $57,582 |
| Carpatho Rusyns | 95.3 /100 | #113 | Exceptional $57,572 |
| Immigrants | Kuwait | 95.3 /100 | #114 | Exceptional $57,562 |
| Swedes | 94.8 /100 | #115 | Exceptional $57,445 |
| Lebanese | 94.6 /100 | #116 | Exceptional $57,409 |
| Immigrants | Zimbabwe | 94.3 /100 | #117 | Exceptional $57,352 |
| Hungarians | 94.0 /100 | #118 | Exceptional $57,309 |
| Arabs | 94.0 /100 | #119 | Exceptional $57,298 |
| Canadians | 93.9 /100 | #120 | Exceptional $57,286 |
| Immigrants | Albania | 93.3 /100 | #121 | Exceptional $57,179 |
| Immigrants | Jordan | 93.1 /100 | #122 | Exceptional $57,145 |
Demographics Similar to Immigrants from Mexico by Median Male Earnings
In terms of median male earnings, the demographic groups most similar to Immigrants from Mexico are Yakama ($45,002, a difference of 0.090%), Kiowa ($45,094, a difference of 0.30%), Native/Alaskan ($44,775, a difference of 0.41%), Bahamian ($44,756, a difference of 0.46%), and Immigrants from Bahamas ($45,176, a difference of 0.48%).
| Demographics | Rating | Rank | Median Male Earnings |
| Immigrants | Central America | 0.0 /100 | #323 | Tragic $45,538 |
| Blacks/African Americans | 0.0 /100 | #324 | Tragic $45,523 |
| Yuman | 0.0 /100 | #325 | Tragic $45,446 |
| Immigrants | Haiti | 0.0 /100 | #326 | Tragic $45,266 |
| Immigrants | Bahamas | 0.0 /100 | #327 | Tragic $45,176 |
| Kiowa | 0.0 /100 | #328 | Tragic $45,094 |
| Yakama | 0.0 /100 | #329 | Tragic $45,002 |
| Immigrants | Mexico | 0.0 /100 | #330 | Tragic $44,960 |
| Natives/Alaskans | 0.0 /100 | #331 | Tragic $44,775 |
| Bahamians | 0.0 /100 | #332 | Tragic $44,756 |
| Immigrants | Congo | 0.0 /100 | #333 | Tragic $44,204 |
| Immigrants | Yemen | 0.0 /100 | #334 | Tragic $44,083 |
| Spanish American Indians | 0.0 /100 | #335 | Tragic $44,010 |
| Immigrants | Cuba | 0.0 /100 | #336 | Tragic $43,461 |
| Menominee | 0.0 /100 | #337 | Tragic $42,581 |