Kenyan vs Romanian Median Male Earnings
COMPARE
Kenyan
Romanian
Median Male Earnings
Median Male Earnings Comparison
Kenyans
Romanians
$53,647
MEDIAN MALE EARNINGS
30.4/ 100
METRIC RATING
193rd/ 347
METRIC RANK
$60,063
MEDIAN MALE EARNINGS
99.6/ 100
METRIC RATING
76th/ 347
METRIC RANK
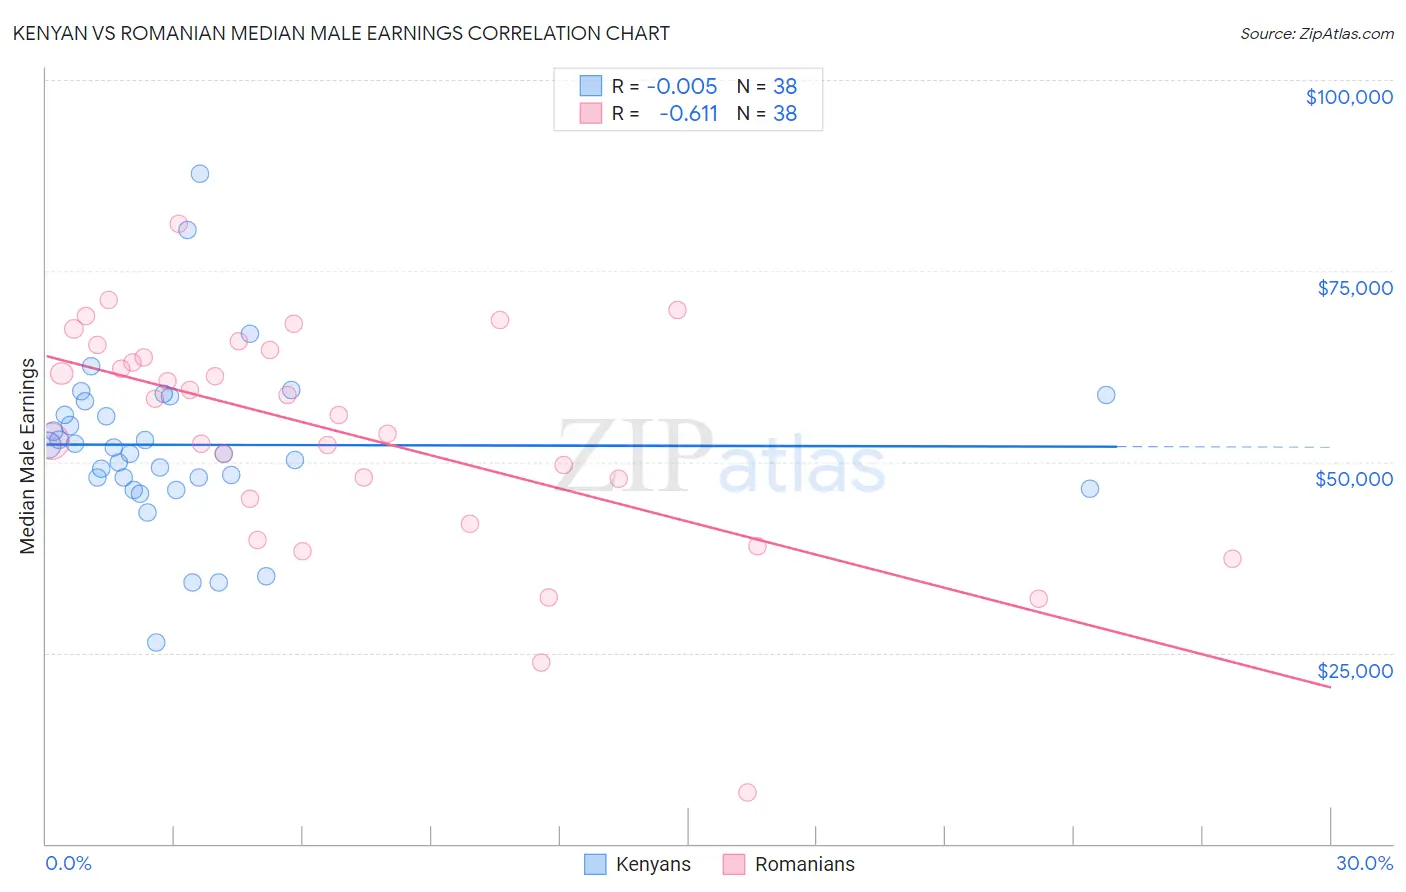
Kenyan vs Romanian Median Male Earnings Correlation Chart
The statistical analysis conducted on geographies consisting of 168,231,087 people shows no correlation between the proportion of Kenyans and median male earnings in the United States with a correlation coefficient (R) of -0.005 and weighted average of $53,647. Similarly, the statistical analysis conducted on geographies consisting of 377,805,375 people shows a significant negative correlation between the proportion of Romanians and median male earnings in the United States with a correlation coefficient (R) of -0.611 and weighted average of $60,063, a difference of 12.0%.
Median Male Earnings Correlation Summary
| Measurement | Kenyan | Romanian |
| Minimum | $26,389 | $6,645 |
| Maximum | $87,784 | $81,155 |
| Range | $61,395 | $74,510 |
| Mean | $52,229 | $53,672 |
| Median | $51,523 | $57,202 |
| Interquartile 25% (IQ1) | $47,893 | $45,217 |
| Interquartile 75% (IQ3) | $57,971 | $64,624 |
| Interquartile Range (IQR) | $10,078 | $19,407 |
| Standard Deviation (Sample) | $11,163 | $15,023 |
| Standard Deviation (Population) | $11,016 | $14,824 |
Similar Demographics by Median Male Earnings
Demographics Similar to Kenyans by Median Male Earnings
In terms of median male earnings, the demographic groups most similar to Kenyans are Scotch-Irish ($53,658, a difference of 0.020%), Guamanian/Chamorro ($53,661, a difference of 0.030%), Uruguayan ($53,680, a difference of 0.060%), Puget Sound Salish ($53,704, a difference of 0.11%), and Immigrants from Eastern Africa ($53,713, a difference of 0.12%).
| Demographics | Rating | Rank | Median Male Earnings |
| Colombians | 34.4 /100 | #186 | Fair $53,832 |
| Immigrants | Eritrea | 31.8 /100 | #187 | Fair $53,715 |
| Immigrants | Eastern Africa | 31.8 /100 | #188 | Fair $53,713 |
| Puget Sound Salish | 31.6 /100 | #189 | Fair $53,704 |
| Uruguayans | 31.1 /100 | #190 | Fair $53,680 |
| Guamanians/Chamorros | 30.7 /100 | #191 | Fair $53,661 |
| Scotch-Irish | 30.6 /100 | #192 | Fair $53,658 |
| Kenyans | 30.4 /100 | #193 | Fair $53,647 |
| Spanish | 29.0 /100 | #194 | Fair $53,576 |
| Immigrants | Azores | 27.5 /100 | #195 | Fair $53,503 |
| Immigrants | Africa | 26.6 /100 | #196 | Fair $53,457 |
| Immigrants | Kenya | 26.0 /100 | #197 | Fair $53,427 |
| Immigrants | Costa Rica | 22.6 /100 | #198 | Fair $53,237 |
| Tongans | 22.3 /100 | #199 | Fair $53,218 |
| Immigrants | Thailand | 17.5 /100 | #200 | Poor $52,908 |
Demographics Similar to Romanians by Median Male Earnings
In terms of median male earnings, the demographic groups most similar to Romanians are Immigrants from Bolivia ($60,088, a difference of 0.040%), Argentinean ($60,117, a difference of 0.090%), Paraguayan ($59,975, a difference of 0.15%), Immigrants from Egypt ($59,925, a difference of 0.23%), and Immigrants from North America ($60,265, a difference of 0.34%).
| Demographics | Rating | Rank | Median Male Earnings |
| Immigrants | Canada | 99.7 /100 | #69 | Exceptional $60,388 |
| Immigrants | Bulgaria | 99.7 /100 | #70 | Exceptional $60,358 |
| Mongolians | 99.7 /100 | #71 | Exceptional $60,350 |
| Immigrants | Western Europe | 99.7 /100 | #72 | Exceptional $60,334 |
| Immigrants | North America | 99.7 /100 | #73 | Exceptional $60,265 |
| Argentineans | 99.6 /100 | #74 | Exceptional $60,117 |
| Immigrants | Bolivia | 99.6 /100 | #75 | Exceptional $60,088 |
| Romanians | 99.6 /100 | #76 | Exceptional $60,063 |
| Paraguayans | 99.5 /100 | #77 | Exceptional $59,975 |
| Immigrants | Egypt | 99.5 /100 | #78 | Exceptional $59,925 |
| Immigrants | Ukraine | 99.5 /100 | #79 | Exceptional $59,820 |
| Immigrants | Hungary | 99.5 /100 | #80 | Exceptional $59,806 |
| Ukrainians | 99.4 /100 | #81 | Exceptional $59,728 |
| Croatians | 99.4 /100 | #82 | Exceptional $59,715 |
| Immigrants | Italy | 99.4 /100 | #83 | Exceptional $59,691 |