Swedish vs Colville Median Male Earnings
COMPARE
Swedish
Colville
Median Male Earnings
Median Male Earnings Comparison
Swedes
Colville
$57,445
MEDIAN MALE EARNINGS
94.8/ 100
METRIC RATING
115th/ 347
METRIC RANK
$48,516
MEDIAN MALE EARNINGS
0.3/ 100
METRIC RATING
274th/ 347
METRIC RANK
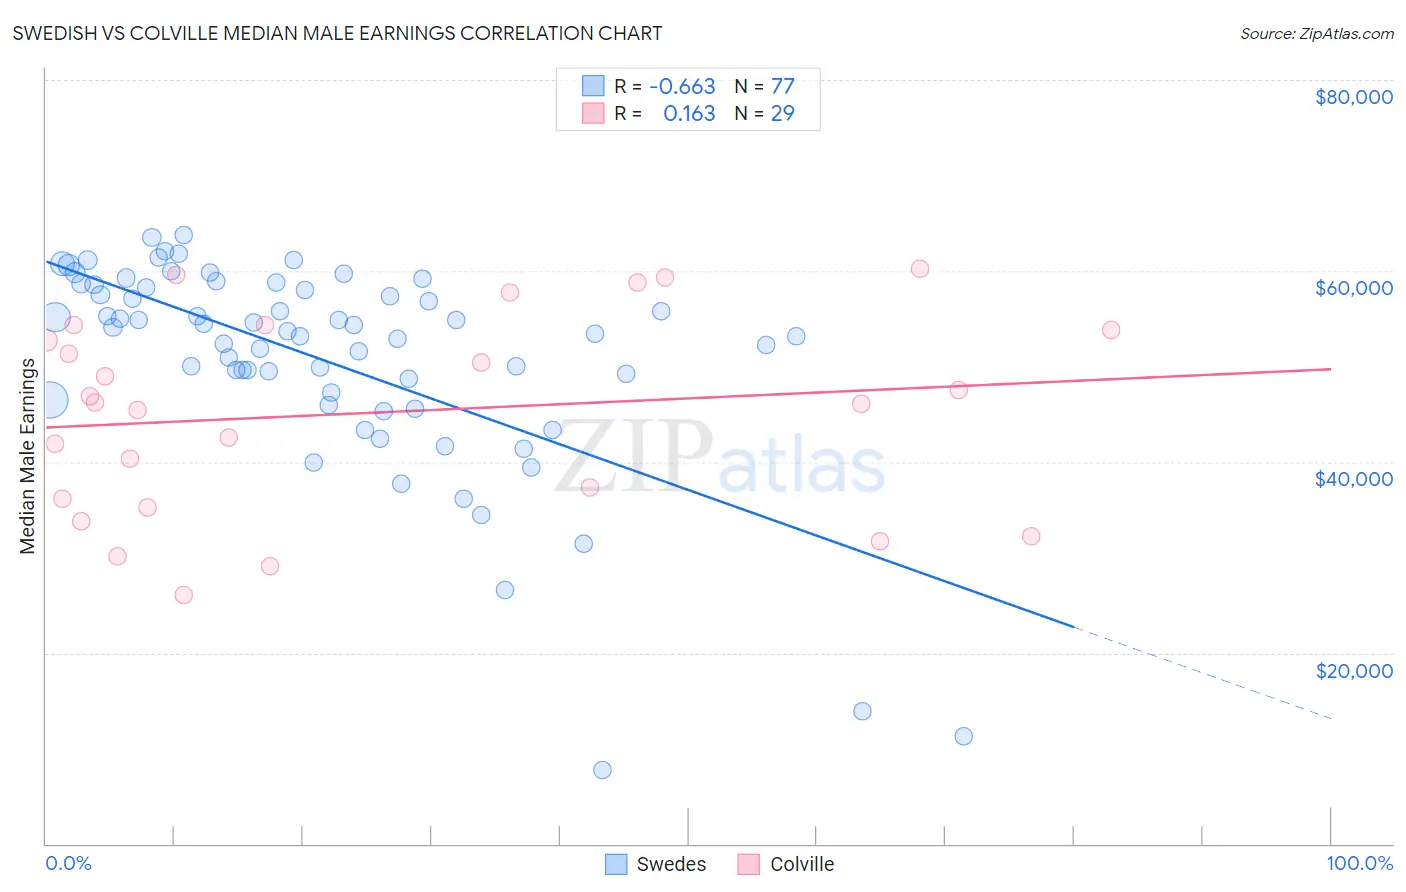
Swedish vs Colville Median Male Earnings Correlation Chart
The statistical analysis conducted on geographies consisting of 538,411,583 people shows a significant negative correlation between the proportion of Swedes and median male earnings in the United States with a correlation coefficient (R) of -0.663 and weighted average of $57,445. Similarly, the statistical analysis conducted on geographies consisting of 34,680,141 people shows a poor positive correlation between the proportion of Colville and median male earnings in the United States with a correlation coefficient (R) of 0.163 and weighted average of $48,516, a difference of 18.4%.
Median Male Earnings Correlation Summary
| Measurement | Swedish | Colville |
| Minimum | $7,750 | $26,071 |
| Maximum | $63,730 | $60,184 |
| Range | $55,980 | $34,113 |
| Mean | $50,664 | $45,174 |
| Median | $53,721 | $46,167 |
| Interquartile 25% (IQ1) | $46,926 | $35,723 |
| Interquartile 75% (IQ3) | $58,399 | $54,047 |
| Interquartile Range (IQR) | $11,473 | $18,325 |
| Standard Deviation (Sample) | $11,170 | $10,311 |
| Standard Deviation (Population) | $11,097 | $10,132 |
Similar Demographics by Median Male Earnings
Demographics Similar to Swedes by Median Male Earnings
In terms of median male earnings, the demographic groups most similar to Swedes are Lebanese ($57,409, a difference of 0.060%), Immigrants from Zimbabwe ($57,352, a difference of 0.16%), Immigrants from Kuwait ($57,562, a difference of 0.20%), Carpatho Rusyn ($57,572, a difference of 0.22%), and Immigrants from Afghanistan ($57,582, a difference of 0.24%).
| Demographics | Rating | Rank | Median Male Earnings |
| Immigrants | Uzbekistan | 96.7 /100 | #108 | Exceptional $57,941 |
| British | 96.5 /100 | #109 | Exceptional $57,890 |
| Palestinians | 96.2 /100 | #110 | Exceptional $57,778 |
| Europeans | 95.6 /100 | #111 | Exceptional $57,637 |
| Immigrants | Afghanistan | 95.4 /100 | #112 | Exceptional $57,582 |
| Carpatho Rusyns | 95.3 /100 | #113 | Exceptional $57,572 |
| Immigrants | Kuwait | 95.3 /100 | #114 | Exceptional $57,562 |
| Swedes | 94.8 /100 | #115 | Exceptional $57,445 |
| Lebanese | 94.6 /100 | #116 | Exceptional $57,409 |
| Immigrants | Zimbabwe | 94.3 /100 | #117 | Exceptional $57,352 |
| Hungarians | 94.0 /100 | #118 | Exceptional $57,309 |
| Arabs | 94.0 /100 | #119 | Exceptional $57,298 |
| Canadians | 93.9 /100 | #120 | Exceptional $57,286 |
| Immigrants | Albania | 93.3 /100 | #121 | Exceptional $57,179 |
| Immigrants | Jordan | 93.1 /100 | #122 | Exceptional $57,145 |
Demographics Similar to Colville by Median Male Earnings
In terms of median male earnings, the demographic groups most similar to Colville are Immigrants from Somalia ($48,439, a difference of 0.16%), Jamaican ($48,632, a difference of 0.24%), Blackfeet ($48,402, a difference of 0.24%), Salvadoran ($48,646, a difference of 0.27%), and Cherokee ($48,669, a difference of 0.32%).
| Demographics | Rating | Rank | Median Male Earnings |
| Spanish Americans | 0.5 /100 | #267 | Tragic $49,008 |
| Ute | 0.4 /100 | #268 | Tragic $48,899 |
| Tsimshian | 0.4 /100 | #269 | Tragic $48,836 |
| Potawatomi | 0.4 /100 | #270 | Tragic $48,768 |
| Cherokee | 0.3 /100 | #271 | Tragic $48,669 |
| Salvadorans | 0.3 /100 | #272 | Tragic $48,646 |
| Jamaicans | 0.3 /100 | #273 | Tragic $48,632 |
| Colville | 0.3 /100 | #274 | Tragic $48,516 |
| Immigrants | Somalia | 0.3 /100 | #275 | Tragic $48,439 |
| Blackfeet | 0.3 /100 | #276 | Tragic $48,402 |
| Belizeans | 0.2 /100 | #277 | Tragic $48,358 |
| Immigrants | Liberia | 0.2 /100 | #278 | Tragic $48,317 |
| Hmong | 0.2 /100 | #279 | Tragic $48,254 |
| Comanche | 0.2 /100 | #280 | Tragic $48,202 |
| Marshallese | 0.2 /100 | #281 | Tragic $48,137 |