Swedish vs Immigrants from Eastern Asia Median Male Earnings
COMPARE
Swedish
Immigrants from Eastern Asia
Median Male Earnings
Median Male Earnings Comparison
Swedes
Immigrants from Eastern Asia
$57,445
MEDIAN MALE EARNINGS
94.8/ 100
METRIC RATING
115th/ 347
METRIC RANK
$66,903
MEDIAN MALE EARNINGS
100.0/ 100
METRIC RATING
15th/ 347
METRIC RANK
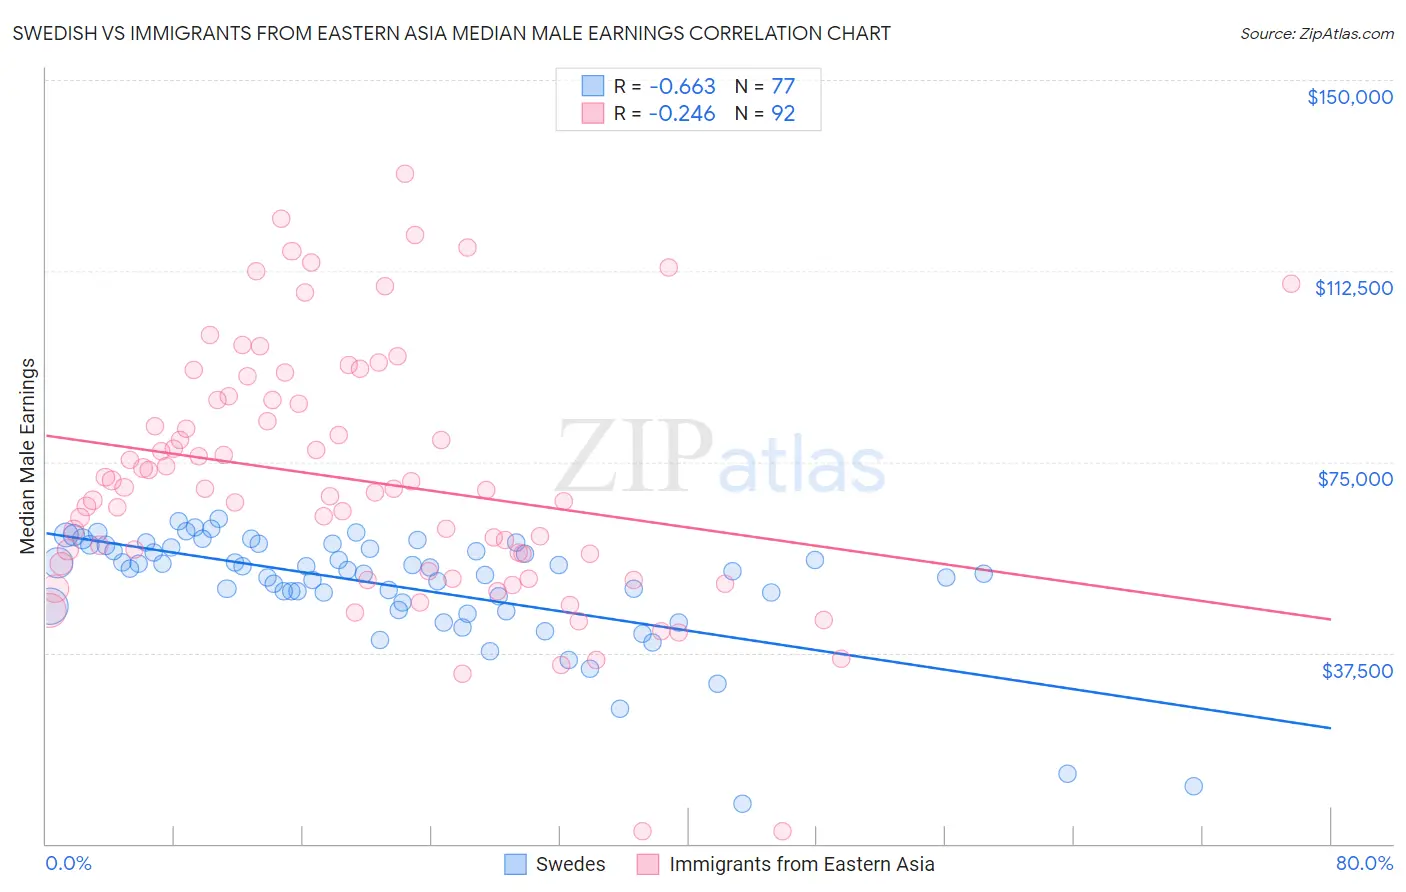
Swedish vs Immigrants from Eastern Asia Median Male Earnings Correlation Chart
The statistical analysis conducted on geographies consisting of 538,411,583 people shows a significant negative correlation between the proportion of Swedes and median male earnings in the United States with a correlation coefficient (R) of -0.663 and weighted average of $57,445. Similarly, the statistical analysis conducted on geographies consisting of 499,639,394 people shows a weak negative correlation between the proportion of Immigrants from Eastern Asia and median male earnings in the United States with a correlation coefficient (R) of -0.246 and weighted average of $66,903, a difference of 16.5%.
Median Male Earnings Correlation Summary
| Measurement | Swedish | Immigrants from Eastern Asia |
| Minimum | $7,750 | $2,499 |
| Maximum | $63,730 | $131,653 |
| Range | $55,980 | $129,154 |
| Mean | $50,664 | $71,397 |
| Median | $53,721 | $69,591 |
| Interquartile 25% (IQ1) | $46,926 | $54,279 |
| Interquartile 75% (IQ3) | $58,399 | $87,124 |
| Interquartile Range (IQR) | $11,473 | $32,845 |
| Standard Deviation (Sample) | $11,170 | $24,831 |
| Standard Deviation (Population) | $11,097 | $24,695 |
Similar Demographics by Median Male Earnings
Demographics Similar to Swedes by Median Male Earnings
In terms of median male earnings, the demographic groups most similar to Swedes are Lebanese ($57,409, a difference of 0.060%), Immigrants from Zimbabwe ($57,352, a difference of 0.16%), Immigrants from Kuwait ($57,562, a difference of 0.20%), Carpatho Rusyn ($57,572, a difference of 0.22%), and Immigrants from Afghanistan ($57,582, a difference of 0.24%).
| Demographics | Rating | Rank | Median Male Earnings |
| Immigrants | Uzbekistan | 96.7 /100 | #108 | Exceptional $57,941 |
| British | 96.5 /100 | #109 | Exceptional $57,890 |
| Palestinians | 96.2 /100 | #110 | Exceptional $57,778 |
| Europeans | 95.6 /100 | #111 | Exceptional $57,637 |
| Immigrants | Afghanistan | 95.4 /100 | #112 | Exceptional $57,582 |
| Carpatho Rusyns | 95.3 /100 | #113 | Exceptional $57,572 |
| Immigrants | Kuwait | 95.3 /100 | #114 | Exceptional $57,562 |
| Swedes | 94.8 /100 | #115 | Exceptional $57,445 |
| Lebanese | 94.6 /100 | #116 | Exceptional $57,409 |
| Immigrants | Zimbabwe | 94.3 /100 | #117 | Exceptional $57,352 |
| Hungarians | 94.0 /100 | #118 | Exceptional $57,309 |
| Arabs | 94.0 /100 | #119 | Exceptional $57,298 |
| Canadians | 93.9 /100 | #120 | Exceptional $57,286 |
| Immigrants | Albania | 93.3 /100 | #121 | Exceptional $57,179 |
| Immigrants | Jordan | 93.1 /100 | #122 | Exceptional $57,145 |
Demographics Similar to Immigrants from Eastern Asia by Median Male Earnings
In terms of median male earnings, the demographic groups most similar to Immigrants from Eastern Asia are Okinawan ($67,232, a difference of 0.49%), Eastern European ($66,472, a difference of 0.65%), Immigrants from China ($67,353, a difference of 0.67%), Immigrants from Australia ($67,634, a difference of 1.1%), and Immigrants from Belgium ($66,125, a difference of 1.2%).
| Demographics | Rating | Rank | Median Male Earnings |
| Immigrants | Iran | 100.0 /100 | #8 | Exceptional $69,284 |
| Immigrants | South Central Asia | 100.0 /100 | #9 | Exceptional $68,960 |
| Immigrants | Israel | 100.0 /100 | #10 | Exceptional $68,716 |
| Immigrants | Ireland | 100.0 /100 | #11 | Exceptional $67,698 |
| Immigrants | Australia | 100.0 /100 | #12 | Exceptional $67,634 |
| Immigrants | China | 100.0 /100 | #13 | Exceptional $67,353 |
| Okinawans | 100.0 /100 | #14 | Exceptional $67,232 |
| Immigrants | Eastern Asia | 100.0 /100 | #15 | Exceptional $66,903 |
| Eastern Europeans | 100.0 /100 | #16 | Exceptional $66,472 |
| Immigrants | Belgium | 100.0 /100 | #17 | Exceptional $66,125 |
| Indians (Asian) | 100.0 /100 | #18 | Exceptional $66,078 |
| Cypriots | 100.0 /100 | #19 | Exceptional $65,549 |
| Immigrants | Japan | 100.0 /100 | #20 | Exceptional $65,518 |
| Immigrants | Sweden | 100.0 /100 | #21 | Exceptional $65,406 |
| Burmese | 100.0 /100 | #22 | Exceptional $65,236 |