Sudanese vs Immigrants from Guyana Per Capita Income
COMPARE
Sudanese
Immigrants from Guyana
Per Capita Income
Per Capita Income Comparison
Sudanese
Immigrants from Guyana
$41,695
PER CAPITA INCOME
9.9/ 100
METRIC RATING
215th/ 347
METRIC RANK
$40,742
PER CAPITA INCOME
3.6/ 100
METRIC RATING
235th/ 347
METRIC RANK
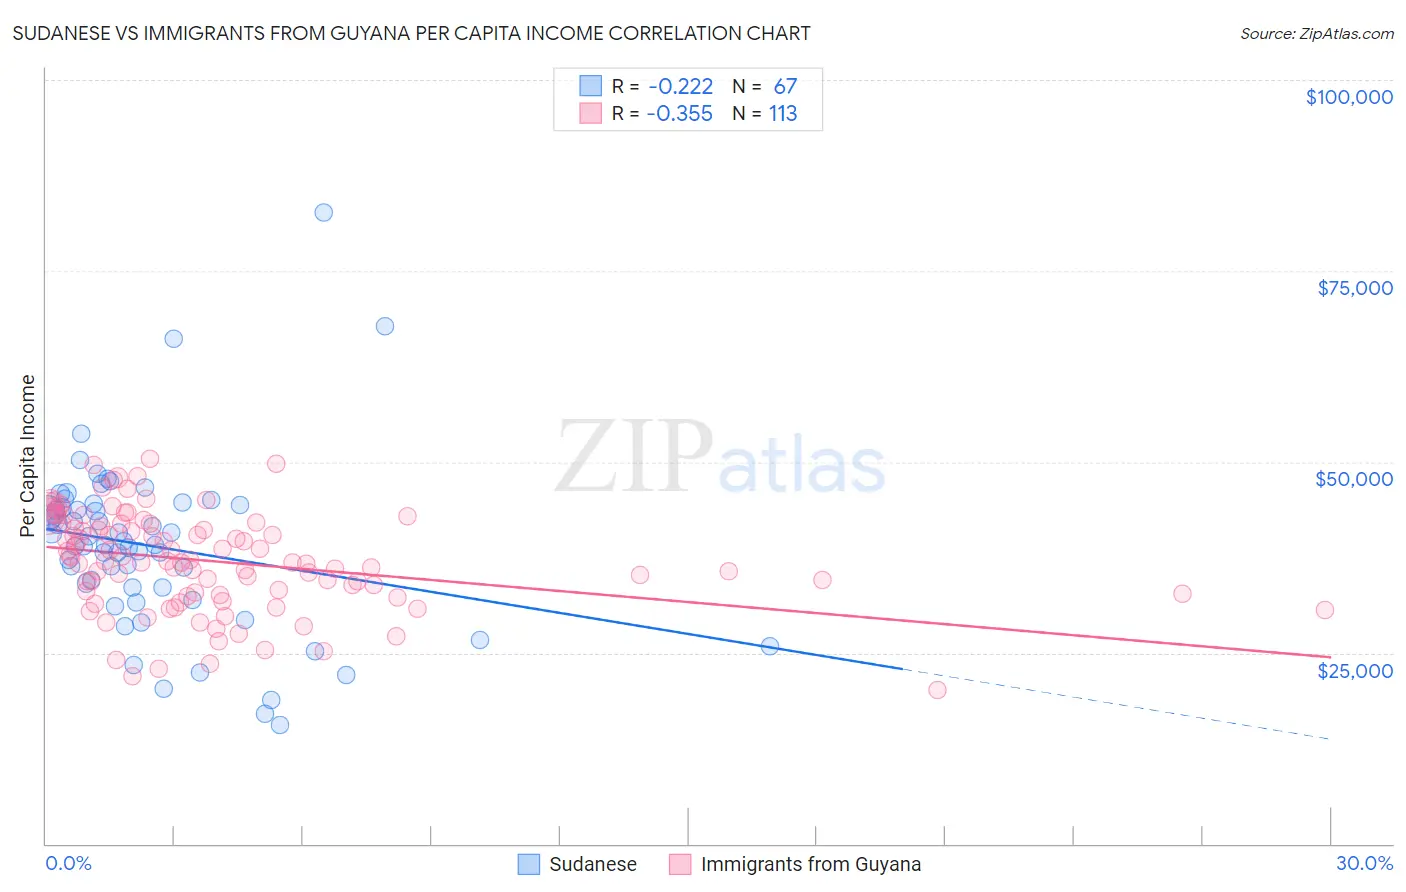
Sudanese vs Immigrants from Guyana Per Capita Income Correlation Chart
The statistical analysis conducted on geographies consisting of 110,152,165 people shows a weak negative correlation between the proportion of Sudanese and per capita income in the United States with a correlation coefficient (R) of -0.222 and weighted average of $41,695. Similarly, the statistical analysis conducted on geographies consisting of 183,742,461 people shows a mild negative correlation between the proportion of Immigrants from Guyana and per capita income in the United States with a correlation coefficient (R) of -0.355 and weighted average of $40,742, a difference of 2.3%.
Per Capita Income Correlation Summary
| Measurement | Sudanese | Immigrants from Guyana |
| Minimum | $15,628 | $20,131 |
| Maximum | $82,685 | $50,352 |
| Range | $67,057 | $30,221 |
| Mean | $38,981 | $36,982 |
| Median | $39,137 | $36,920 |
| Interquartile 25% (IQ1) | $33,494 | $32,654 |
| Interquartile 75% (IQ3) | $44,276 | $41,898 |
| Interquartile Range (IQR) | $10,782 | $9,245 |
| Standard Deviation (Sample) | $11,237 | $6,465 |
| Standard Deviation (Population) | $11,153 | $6,436 |
Demographics Similar to Sudanese and Immigrants from Guyana by Per Capita Income
In terms of per capita income, the demographic groups most similar to Sudanese are Tongan ($41,693, a difference of 0.010%), Guamanian/Chamorro ($41,678, a difference of 0.040%), Trinidadian and Tobagonian ($41,655, a difference of 0.10%), Puget Sound Salish ($41,495, a difference of 0.48%), and Immigrants from Barbados ($41,478, a difference of 0.52%). Similarly, the demographic groups most similar to Immigrants from Guyana are Immigrants from West Indies ($40,763, a difference of 0.050%), Delaware ($40,778, a difference of 0.090%), Guyanese ($40,949, a difference of 0.51%), Senegalese ($41,000, a difference of 0.63%), and Native Hawaiian ($41,017, a difference of 0.67%).
| Demographics | Rating | Rank | Per Capita Income |
| Sudanese | 9.9 /100 | #215 | Tragic $41,695 |
| Tongans | 9.9 /100 | #216 | Tragic $41,693 |
| Guamanians/Chamorros | 9.7 /100 | #217 | Tragic $41,678 |
| Trinidadians and Tobagonians | 9.5 /100 | #218 | Tragic $41,655 |
| Puget Sound Salish | 8.1 /100 | #219 | Tragic $41,495 |
| Immigrants | Barbados | 7.9 /100 | #220 | Tragic $41,478 |
| Immigrants | Trinidad and Tobago | 7.9 /100 | #221 | Tragic $41,476 |
| Immigrants | Iraq | 7.1 /100 | #222 | Tragic $41,365 |
| Immigrants | Cameroon | 6.8 /100 | #223 | Tragic $41,334 |
| Immigrants | St. Vincent and the Grenadines | 6.4 /100 | #224 | Tragic $41,270 |
| West Indians | 6.0 /100 | #225 | Tragic $41,217 |
| Immigrants | Ecuador | 5.9 /100 | #226 | Tragic $41,195 |
| Immigrants | Ghana | 5.5 /100 | #227 | Tragic $41,131 |
| Immigrants | Grenada | 5.5 /100 | #228 | Tragic $41,123 |
| Nigerians | 4.9 /100 | #229 | Tragic $41,026 |
| Native Hawaiians | 4.9 /100 | #230 | Tragic $41,017 |
| Senegalese | 4.8 /100 | #231 | Tragic $41,000 |
| Guyanese | 4.5 /100 | #232 | Tragic $40,949 |
| Delaware | 3.8 /100 | #233 | Tragic $40,778 |
| Immigrants | West Indies | 3.7 /100 | #234 | Tragic $40,763 |
| Immigrants | Guyana | 3.6 /100 | #235 | Tragic $40,742 |