Sudanese vs Immigrants from West Indies Per Capita Income
COMPARE
Sudanese
Immigrants from West Indies
Per Capita Income
Per Capita Income Comparison
Sudanese
Immigrants from West Indies
$41,695
PER CAPITA INCOME
9.9/ 100
METRIC RATING
215th/ 347
METRIC RANK
$40,763
PER CAPITA INCOME
3.7/ 100
METRIC RATING
234th/ 347
METRIC RANK
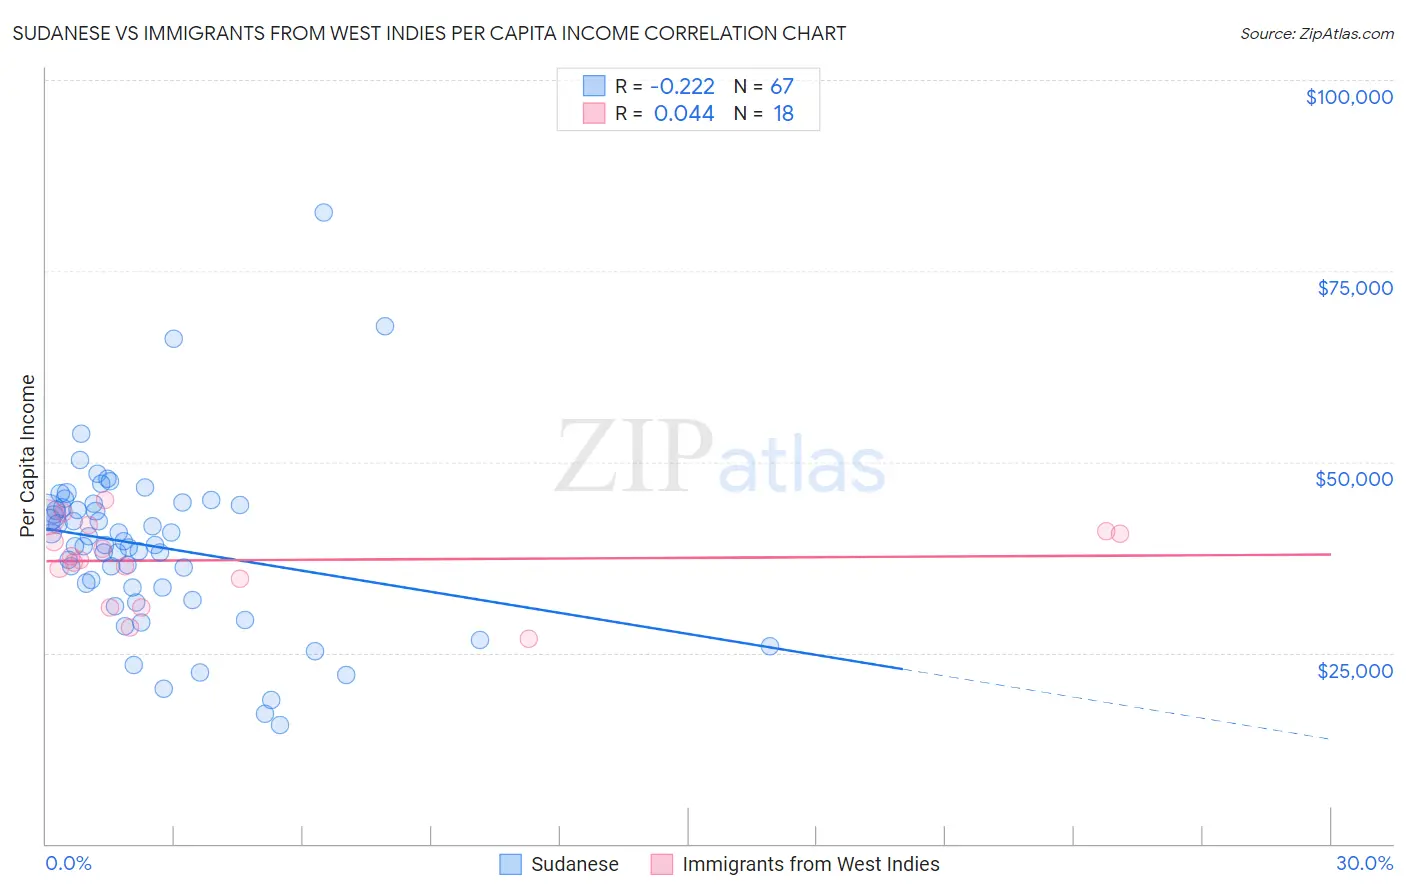
Sudanese vs Immigrants from West Indies Per Capita Income Correlation Chart
The statistical analysis conducted on geographies consisting of 110,152,165 people shows a weak negative correlation between the proportion of Sudanese and per capita income in the United States with a correlation coefficient (R) of -0.222 and weighted average of $41,695. Similarly, the statistical analysis conducted on geographies consisting of 72,420,477 people shows no correlation between the proportion of Immigrants from West Indies and per capita income in the United States with a correlation coefficient (R) of 0.044 and weighted average of $40,763, a difference of 2.3%.
Per Capita Income Correlation Summary
| Measurement | Sudanese | Immigrants from West Indies |
| Minimum | $15,628 | $26,894 |
| Maximum | $82,685 | $45,008 |
| Range | $67,057 | $18,114 |
| Mean | $38,981 | $37,133 |
| Median | $39,137 | $37,421 |
| Interquartile 25% (IQ1) | $33,494 | $34,659 |
| Interquartile 75% (IQ3) | $44,276 | $40,860 |
| Interquartile Range (IQR) | $10,782 | $6,201 |
| Standard Deviation (Sample) | $11,237 | $5,188 |
| Standard Deviation (Population) | $11,153 | $5,042 |
Demographics Similar to Sudanese and Immigrants from West Indies by Per Capita Income
In terms of per capita income, the demographic groups most similar to Sudanese are Tongan ($41,693, a difference of 0.010%), Immigrants from Bangladesh ($41,709, a difference of 0.030%), Guamanian/Chamorro ($41,678, a difference of 0.040%), Trinidadian and Tobagonian ($41,655, a difference of 0.10%), and Puget Sound Salish ($41,495, a difference of 0.48%). Similarly, the demographic groups most similar to Immigrants from West Indies are Delaware ($40,778, a difference of 0.040%), Guyanese ($40,949, a difference of 0.46%), Senegalese ($41,000, a difference of 0.58%), Native Hawaiian ($41,017, a difference of 0.62%), and Nigerian ($41,026, a difference of 0.65%).
| Demographics | Rating | Rank | Per Capita Income |
| Immigrants | Bangladesh | 10.1 /100 | #214 | Poor $41,709 |
| Sudanese | 9.9 /100 | #215 | Tragic $41,695 |
| Tongans | 9.9 /100 | #216 | Tragic $41,693 |
| Guamanians/Chamorros | 9.7 /100 | #217 | Tragic $41,678 |
| Trinidadians and Tobagonians | 9.5 /100 | #218 | Tragic $41,655 |
| Puget Sound Salish | 8.1 /100 | #219 | Tragic $41,495 |
| Immigrants | Barbados | 7.9 /100 | #220 | Tragic $41,478 |
| Immigrants | Trinidad and Tobago | 7.9 /100 | #221 | Tragic $41,476 |
| Immigrants | Iraq | 7.1 /100 | #222 | Tragic $41,365 |
| Immigrants | Cameroon | 6.8 /100 | #223 | Tragic $41,334 |
| Immigrants | St. Vincent and the Grenadines | 6.4 /100 | #224 | Tragic $41,270 |
| West Indians | 6.0 /100 | #225 | Tragic $41,217 |
| Immigrants | Ecuador | 5.9 /100 | #226 | Tragic $41,195 |
| Immigrants | Ghana | 5.5 /100 | #227 | Tragic $41,131 |
| Immigrants | Grenada | 5.5 /100 | #228 | Tragic $41,123 |
| Nigerians | 4.9 /100 | #229 | Tragic $41,026 |
| Native Hawaiians | 4.9 /100 | #230 | Tragic $41,017 |
| Senegalese | 4.8 /100 | #231 | Tragic $41,000 |
| Guyanese | 4.5 /100 | #232 | Tragic $40,949 |
| Delaware | 3.8 /100 | #233 | Tragic $40,778 |
| Immigrants | West Indies | 3.7 /100 | #234 | Tragic $40,763 |