Sudanese vs Immigrants from South Eastern Asia Per Capita Income
COMPARE
Sudanese
Immigrants from South Eastern Asia
Per Capita Income
Per Capita Income Comparison
Sudanese
Immigrants from South Eastern Asia
$41,695
PER CAPITA INCOME
9.9/ 100
METRIC RATING
215th/ 347
METRIC RANK
$43,539
PER CAPITA INCOME
46.6/ 100
METRIC RATING
176th/ 347
METRIC RANK
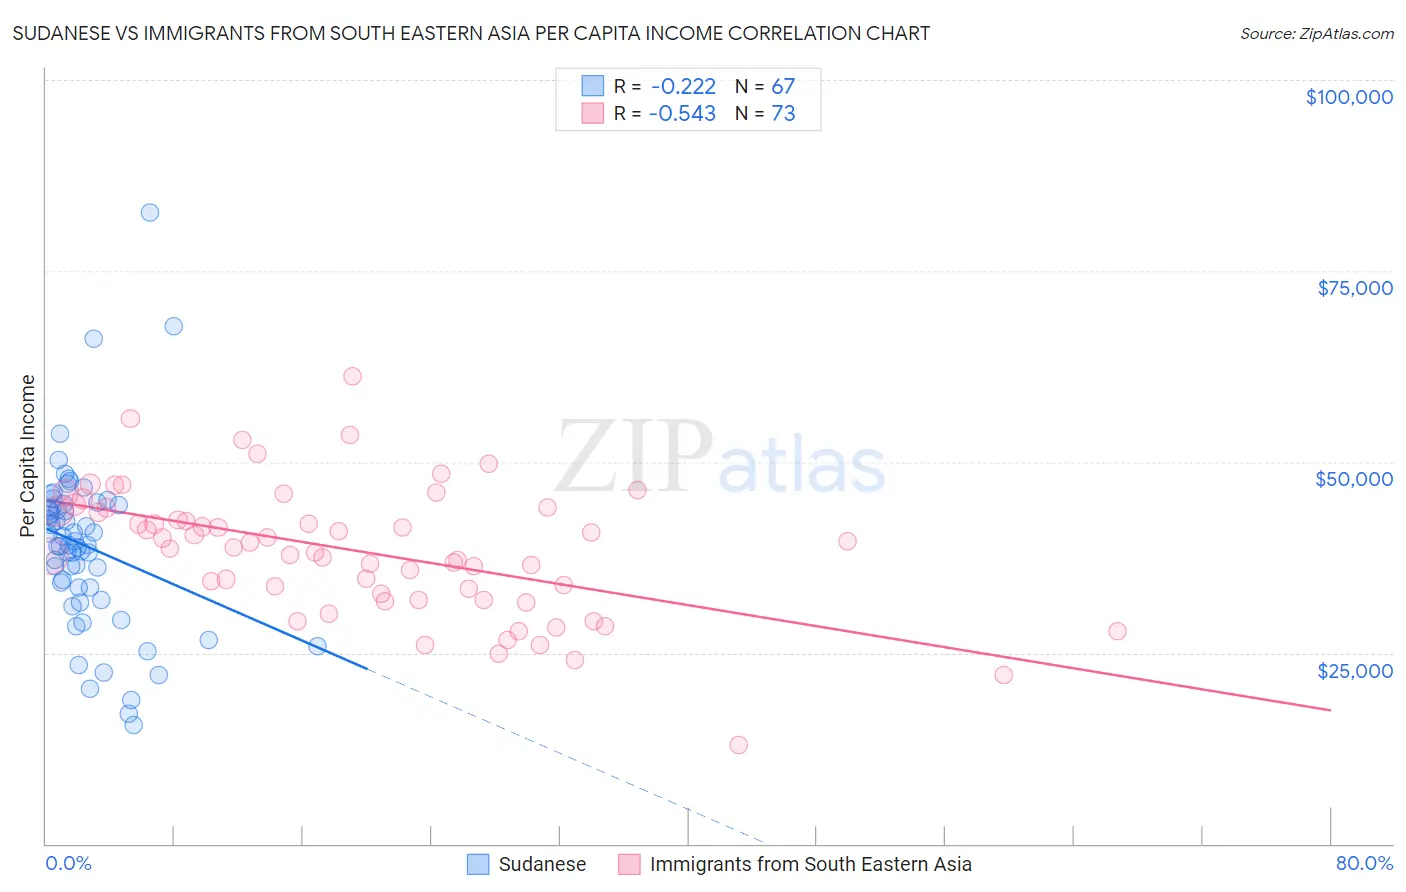
Sudanese vs Immigrants from South Eastern Asia Per Capita Income Correlation Chart
The statistical analysis conducted on geographies consisting of 110,152,165 people shows a weak negative correlation between the proportion of Sudanese and per capita income in the United States with a correlation coefficient (R) of -0.222 and weighted average of $41,695. Similarly, the statistical analysis conducted on geographies consisting of 512,740,931 people shows a substantial negative correlation between the proportion of Immigrants from South Eastern Asia and per capita income in the United States with a correlation coefficient (R) of -0.543 and weighted average of $43,539, a difference of 4.4%.
Per Capita Income Correlation Summary
| Measurement | Sudanese | Immigrants from South Eastern Asia |
| Minimum | $15,628 | $12,941 |
| Maximum | $82,685 | $61,192 |
| Range | $67,057 | $48,251 |
| Mean | $38,981 | $38,281 |
| Median | $39,137 | $38,844 |
| Interquartile 25% (IQ1) | $33,494 | $32,392 |
| Interquartile 75% (IQ3) | $44,276 | $43,736 |
| Interquartile Range (IQR) | $10,782 | $11,344 |
| Standard Deviation (Sample) | $11,237 | $8,472 |
| Standard Deviation (Population) | $11,153 | $8,414 |
Similar Demographics by Per Capita Income
Demographics Similar to Sudanese by Per Capita Income
In terms of per capita income, the demographic groups most similar to Sudanese are Tongan ($41,693, a difference of 0.010%), Immigrants from Bangladesh ($41,709, a difference of 0.030%), Guamanian/Chamorro ($41,678, a difference of 0.040%), Immigrants from Venezuela ($41,727, a difference of 0.080%), and Trinidadian and Tobagonian ($41,655, a difference of 0.10%).
| Demographics | Rating | Rank | Per Capita Income |
| Panamanians | 13.9 /100 | #208 | Poor $42,035 |
| Immigrants | Sudan | 13.2 /100 | #209 | Poor $41,986 |
| Ecuadorians | 12.9 /100 | #210 | Poor $41,958 |
| Immigrants | Panama | 11.6 /100 | #211 | Poor $41,853 |
| Immigrants | Senegal | 11.3 /100 | #212 | Poor $41,830 |
| Immigrants | Venezuela | 10.2 /100 | #213 | Poor $41,727 |
| Immigrants | Bangladesh | 10.1 /100 | #214 | Poor $41,709 |
| Sudanese | 9.9 /100 | #215 | Tragic $41,695 |
| Tongans | 9.9 /100 | #216 | Tragic $41,693 |
| Guamanians/Chamorros | 9.7 /100 | #217 | Tragic $41,678 |
| Trinidadians and Tobagonians | 9.5 /100 | #218 | Tragic $41,655 |
| Puget Sound Salish | 8.1 /100 | #219 | Tragic $41,495 |
| Immigrants | Barbados | 7.9 /100 | #220 | Tragic $41,478 |
| Immigrants | Trinidad and Tobago | 7.9 /100 | #221 | Tragic $41,476 |
| Immigrants | Iraq | 7.1 /100 | #222 | Tragic $41,365 |
Demographics Similar to Immigrants from South Eastern Asia by Per Capita Income
In terms of per capita income, the demographic groups most similar to Immigrants from South Eastern Asia are Tlingit-Haida ($43,516, a difference of 0.050%), Immigrants from Costa Rica ($43,464, a difference of 0.17%), Finnish ($43,461, a difference of 0.18%), Celtic ($43,621, a difference of 0.19%), and Colombian ($43,661, a difference of 0.28%).
| Demographics | Rating | Rank | Per Capita Income |
| Immigrants | Peru | 55.3 /100 | #169 | Average $43,852 |
| Scandinavians | 55.2 /100 | #170 | Average $43,848 |
| Immigrants | Eastern Africa | 54.9 /100 | #171 | Average $43,838 |
| Czechoslovakians | 54.1 /100 | #172 | Average $43,806 |
| French | 50.7 /100 | #173 | Average $43,685 |
| Colombians | 50.0 /100 | #174 | Average $43,661 |
| Celtics | 48.9 /100 | #175 | Average $43,621 |
| Immigrants | South Eastern Asia | 46.6 /100 | #176 | Average $43,539 |
| Tlingit-Haida | 45.9 /100 | #177 | Average $43,516 |
| Immigrants | Costa Rica | 44.5 /100 | #178 | Average $43,464 |
| Finns | 44.4 /100 | #179 | Average $43,461 |
| Sierra Leoneans | 42.9 /100 | #180 | Average $43,405 |
| Welsh | 38.2 /100 | #181 | Fair $43,233 |
| Immigrants | Vietnam | 38.1 /100 | #182 | Fair $43,229 |
| Germans | 33.9 /100 | #183 | Fair $43,067 |