Sudanese vs Burmese Per Capita Income
COMPARE
Sudanese
Burmese
Per Capita Income
Per Capita Income Comparison
Sudanese
Burmese
$41,695
PER CAPITA INCOME
9.9/ 100
METRIC RATING
215th/ 347
METRIC RANK
$52,005
PER CAPITA INCOME
100.0/ 100
METRIC RATING
35th/ 347
METRIC RANK
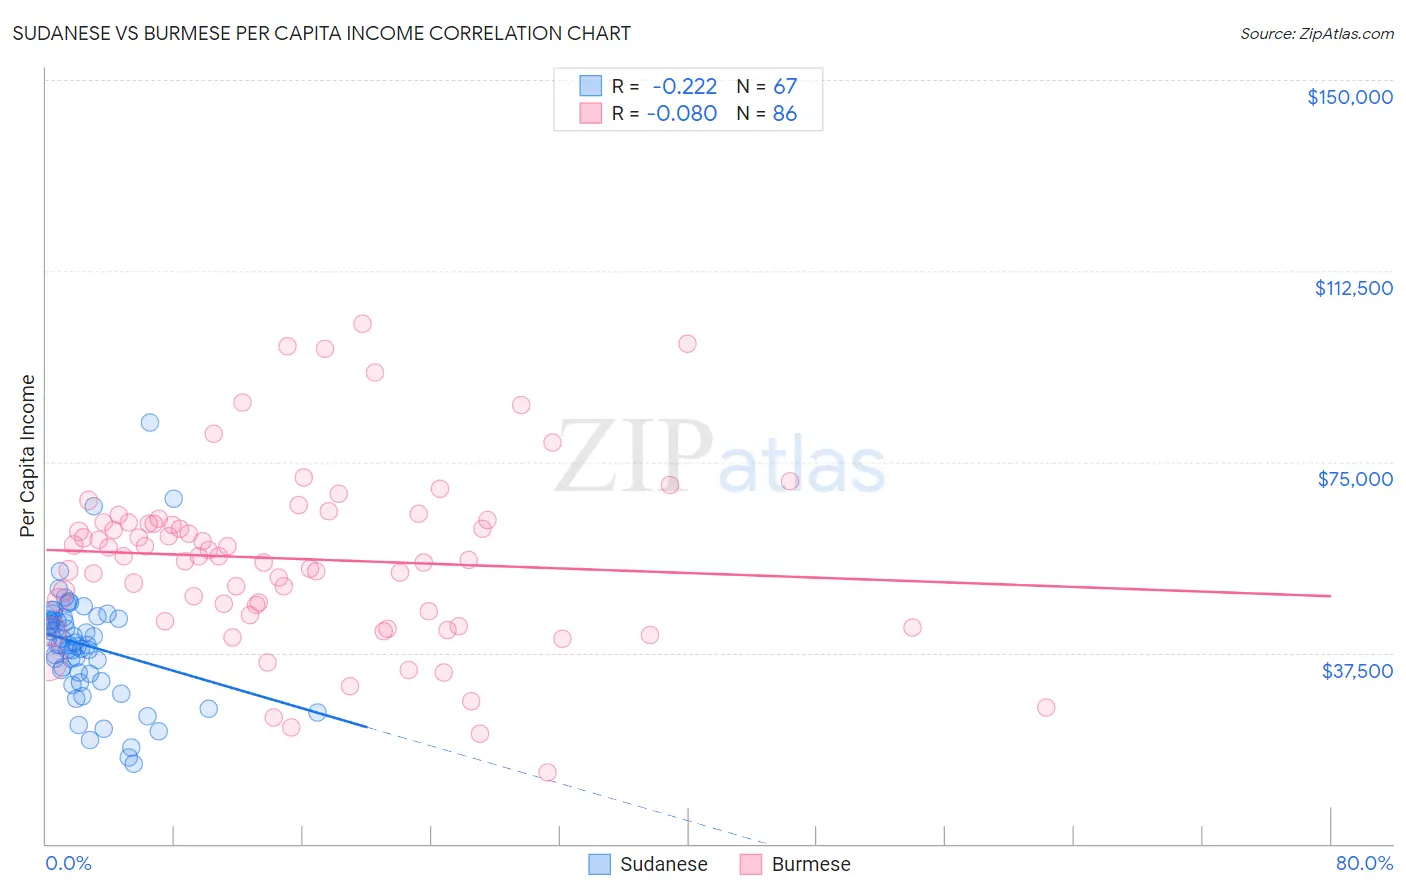
Sudanese vs Burmese Per Capita Income Correlation Chart
The statistical analysis conducted on geographies consisting of 110,152,165 people shows a weak negative correlation between the proportion of Sudanese and per capita income in the United States with a correlation coefficient (R) of -0.222 and weighted average of $41,695. Similarly, the statistical analysis conducted on geographies consisting of 465,453,233 people shows a slight negative correlation between the proportion of Burmese and per capita income in the United States with a correlation coefficient (R) of -0.080 and weighted average of $52,005, a difference of 24.7%.
Per Capita Income Correlation Summary
| Measurement | Sudanese | Burmese |
| Minimum | $15,628 | $14,082 |
| Maximum | $82,685 | $102,113 |
| Range | $67,057 | $88,031 |
| Mean | $38,981 | $55,927 |
| Median | $39,137 | $56,416 |
| Interquartile 25% (IQ1) | $33,494 | $45,035 |
| Interquartile 75% (IQ3) | $44,276 | $63,196 |
| Interquartile Range (IQR) | $10,782 | $18,162 |
| Standard Deviation (Sample) | $11,237 | $17,378 |
| Standard Deviation (Population) | $11,153 | $17,276 |
Similar Demographics by Per Capita Income
Demographics Similar to Sudanese by Per Capita Income
In terms of per capita income, the demographic groups most similar to Sudanese are Tongan ($41,693, a difference of 0.010%), Immigrants from Bangladesh ($41,709, a difference of 0.030%), Guamanian/Chamorro ($41,678, a difference of 0.040%), Immigrants from Venezuela ($41,727, a difference of 0.080%), and Trinidadian and Tobagonian ($41,655, a difference of 0.10%).
| Demographics | Rating | Rank | Per Capita Income |
| Panamanians | 13.9 /100 | #208 | Poor $42,035 |
| Immigrants | Sudan | 13.2 /100 | #209 | Poor $41,986 |
| Ecuadorians | 12.9 /100 | #210 | Poor $41,958 |
| Immigrants | Panama | 11.6 /100 | #211 | Poor $41,853 |
| Immigrants | Senegal | 11.3 /100 | #212 | Poor $41,830 |
| Immigrants | Venezuela | 10.2 /100 | #213 | Poor $41,727 |
| Immigrants | Bangladesh | 10.1 /100 | #214 | Poor $41,709 |
| Sudanese | 9.9 /100 | #215 | Tragic $41,695 |
| Tongans | 9.9 /100 | #216 | Tragic $41,693 |
| Guamanians/Chamorros | 9.7 /100 | #217 | Tragic $41,678 |
| Trinidadians and Tobagonians | 9.5 /100 | #218 | Tragic $41,655 |
| Puget Sound Salish | 8.1 /100 | #219 | Tragic $41,495 |
| Immigrants | Barbados | 7.9 /100 | #220 | Tragic $41,478 |
| Immigrants | Trinidad and Tobago | 7.9 /100 | #221 | Tragic $41,476 |
| Immigrants | Iraq | 7.1 /100 | #222 | Tragic $41,365 |
Demographics Similar to Burmese by Per Capita Income
In terms of per capita income, the demographic groups most similar to Burmese are Immigrants from Russia ($52,044, a difference of 0.070%), Australian ($52,074, a difference of 0.13%), Immigrants from Greece ($51,891, a difference of 0.22%), Estonian ($51,875, a difference of 0.25%), and Immigrants from Norway ($52,217, a difference of 0.41%).
| Demographics | Rating | Rank | Per Capita Income |
| Latvians | 100.0 /100 | #28 | Exceptional $52,649 |
| Israelis | 100.0 /100 | #29 | Exceptional $52,596 |
| Immigrants | Austria | 100.0 /100 | #30 | Exceptional $52,503 |
| Turks | 100.0 /100 | #31 | Exceptional $52,391 |
| Immigrants | Norway | 100.0 /100 | #32 | Exceptional $52,217 |
| Australians | 100.0 /100 | #33 | Exceptional $52,074 |
| Immigrants | Russia | 100.0 /100 | #34 | Exceptional $52,044 |
| Burmese | 100.0 /100 | #35 | Exceptional $52,005 |
| Immigrants | Greece | 100.0 /100 | #36 | Exceptional $51,891 |
| Estonians | 100.0 /100 | #37 | Exceptional $51,875 |
| Immigrants | Czechoslovakia | 100.0 /100 | #38 | Exceptional $51,770 |
| Cambodians | 100.0 /100 | #39 | Exceptional $51,731 |
| Immigrants | Korea | 100.0 /100 | #40 | Exceptional $51,671 |
| Immigrants | South Africa | 100.0 /100 | #41 | Exceptional $51,465 |
| Immigrants | Turkey | 100.0 /100 | #42 | Exceptional $51,368 |