Sudanese vs Greek Per Capita Income
COMPARE
Sudanese
Greek
Per Capita Income
Per Capita Income Comparison
Sudanese
Greeks
$41,695
PER CAPITA INCOME
9.9/ 100
METRIC RATING
215th/ 347
METRIC RANK
$49,309
PER CAPITA INCOME
99.8/ 100
METRIC RATING
71st/ 347
METRIC RANK
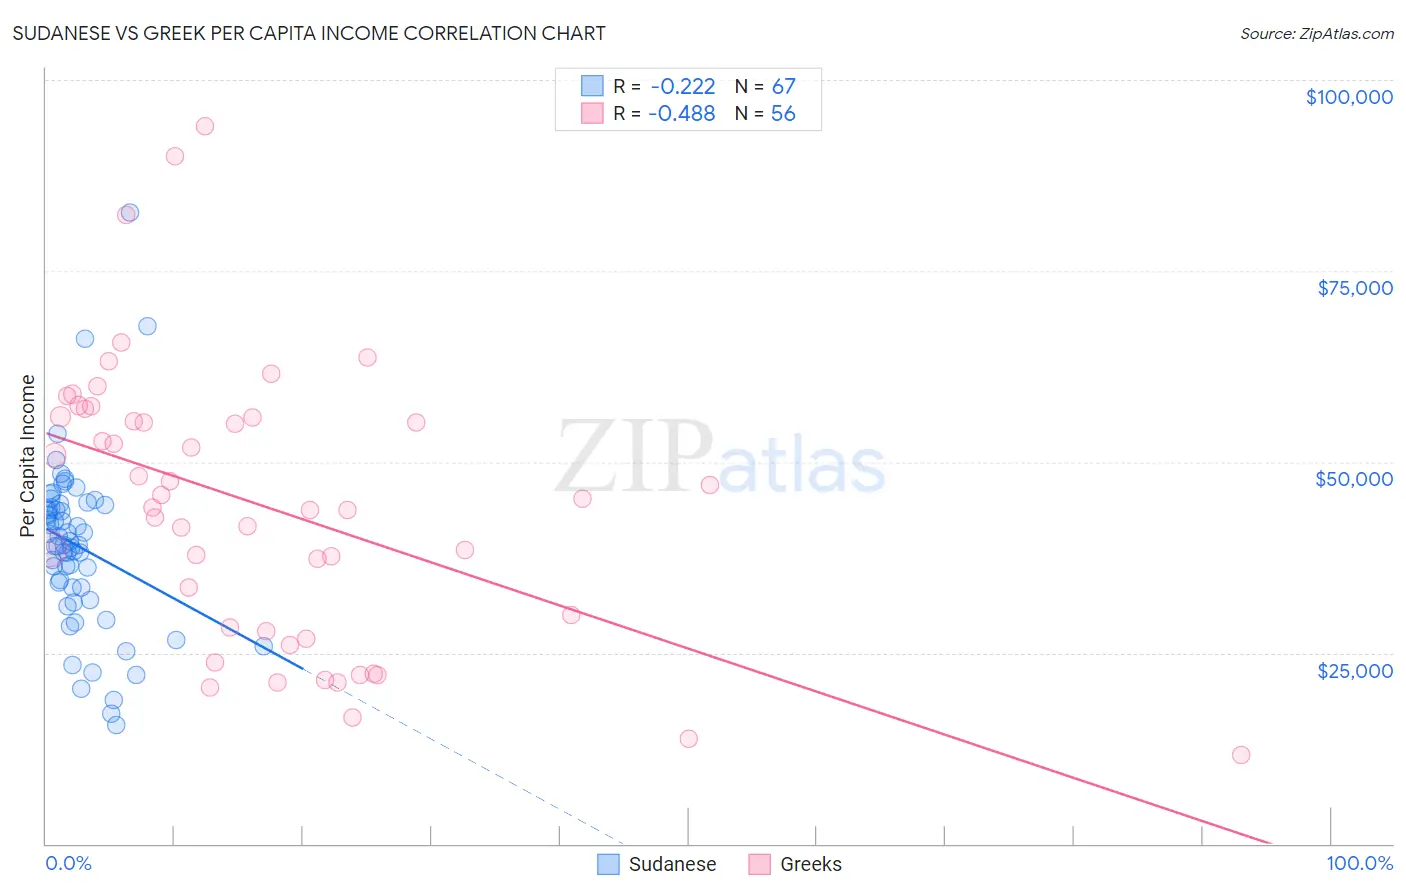
Sudanese vs Greek Per Capita Income Correlation Chart
The statistical analysis conducted on geographies consisting of 110,152,165 people shows a weak negative correlation between the proportion of Sudanese and per capita income in the United States with a correlation coefficient (R) of -0.222 and weighted average of $41,695. Similarly, the statistical analysis conducted on geographies consisting of 482,808,471 people shows a moderate negative correlation between the proportion of Greeks and per capita income in the United States with a correlation coefficient (R) of -0.488 and weighted average of $49,309, a difference of 18.3%.
Per Capita Income Correlation Summary
| Measurement | Sudanese | Greek |
| Minimum | $15,628 | $11,668 |
| Maximum | $82,685 | $93,958 |
| Range | $67,057 | $82,290 |
| Mean | $38,981 | $44,253 |
| Median | $39,137 | $44,552 |
| Interquartile 25% (IQ1) | $33,494 | $28,035 |
| Interquartile 75% (IQ3) | $44,276 | $55,859 |
| Interquartile Range (IQR) | $10,782 | $27,823 |
| Standard Deviation (Sample) | $11,237 | $18,189 |
| Standard Deviation (Population) | $11,153 | $18,026 |
Similar Demographics by Per Capita Income
Demographics Similar to Sudanese by Per Capita Income
In terms of per capita income, the demographic groups most similar to Sudanese are Tongan ($41,693, a difference of 0.010%), Immigrants from Bangladesh ($41,709, a difference of 0.030%), Guamanian/Chamorro ($41,678, a difference of 0.040%), Immigrants from Venezuela ($41,727, a difference of 0.080%), and Trinidadian and Tobagonian ($41,655, a difference of 0.10%).
| Demographics | Rating | Rank | Per Capita Income |
| Panamanians | 13.9 /100 | #208 | Poor $42,035 |
| Immigrants | Sudan | 13.2 /100 | #209 | Poor $41,986 |
| Ecuadorians | 12.9 /100 | #210 | Poor $41,958 |
| Immigrants | Panama | 11.6 /100 | #211 | Poor $41,853 |
| Immigrants | Senegal | 11.3 /100 | #212 | Poor $41,830 |
| Immigrants | Venezuela | 10.2 /100 | #213 | Poor $41,727 |
| Immigrants | Bangladesh | 10.1 /100 | #214 | Poor $41,709 |
| Sudanese | 9.9 /100 | #215 | Tragic $41,695 |
| Tongans | 9.9 /100 | #216 | Tragic $41,693 |
| Guamanians/Chamorros | 9.7 /100 | #217 | Tragic $41,678 |
| Trinidadians and Tobagonians | 9.5 /100 | #218 | Tragic $41,655 |
| Puget Sound Salish | 8.1 /100 | #219 | Tragic $41,495 |
| Immigrants | Barbados | 7.9 /100 | #220 | Tragic $41,478 |
| Immigrants | Trinidad and Tobago | 7.9 /100 | #221 | Tragic $41,476 |
| Immigrants | Iraq | 7.1 /100 | #222 | Tragic $41,365 |
Demographics Similar to Greeks by Per Capita Income
In terms of per capita income, the demographic groups most similar to Greeks are Immigrants from Eastern Europe ($49,316, a difference of 0.010%), Immigrants from Hungary ($49,303, a difference of 0.010%), Immigrants from North America ($49,302, a difference of 0.010%), Immigrants from Canada ($49,412, a difference of 0.21%), and Lithuanian ($49,448, a difference of 0.28%).
| Demographics | Rating | Rank | Per Capita Income |
| Immigrants | Argentina | 99.9 /100 | #64 | Exceptional $49,627 |
| Bolivians | 99.9 /100 | #65 | Exceptional $49,526 |
| Immigrants | Bulgaria | 99.9 /100 | #66 | Exceptional $49,482 |
| Immigrants | Romania | 99.9 /100 | #67 | Exceptional $49,463 |
| Lithuanians | 99.8 /100 | #68 | Exceptional $49,448 |
| Immigrants | Canada | 99.8 /100 | #69 | Exceptional $49,412 |
| Immigrants | Eastern Europe | 99.8 /100 | #70 | Exceptional $49,316 |
| Greeks | 99.8 /100 | #71 | Exceptional $49,309 |
| Immigrants | Hungary | 99.8 /100 | #72 | Exceptional $49,303 |
| Immigrants | North America | 99.8 /100 | #73 | Exceptional $49,302 |
| Mongolians | 99.8 /100 | #74 | Exceptional $49,173 |
| Immigrants | Bolivia | 99.7 /100 | #75 | Exceptional $48,970 |
| Immigrants | England | 99.7 /100 | #76 | Exceptional $48,844 |
| Immigrants | Kazakhstan | 99.7 /100 | #77 | Exceptional $48,747 |
| Immigrants | Italy | 99.6 /100 | #78 | Exceptional $48,654 |