Subsaharan African vs South American Householder Income Under 25 years
COMPARE
Subsaharan African
South American
Householder Income Under 25 years
Householder Income Under 25 years Comparison
Sub-Saharan Africans
South Americans
$48,691
HOUSEHOLDER INCOME UNDER 25 YEARS
0.0/ 100
METRIC RATING
293rd/ 347
METRIC RANK
$53,939
HOUSEHOLDER INCOME UNDER 25 YEARS
98.6/ 100
METRIC RATING
101st/ 347
METRIC RANK
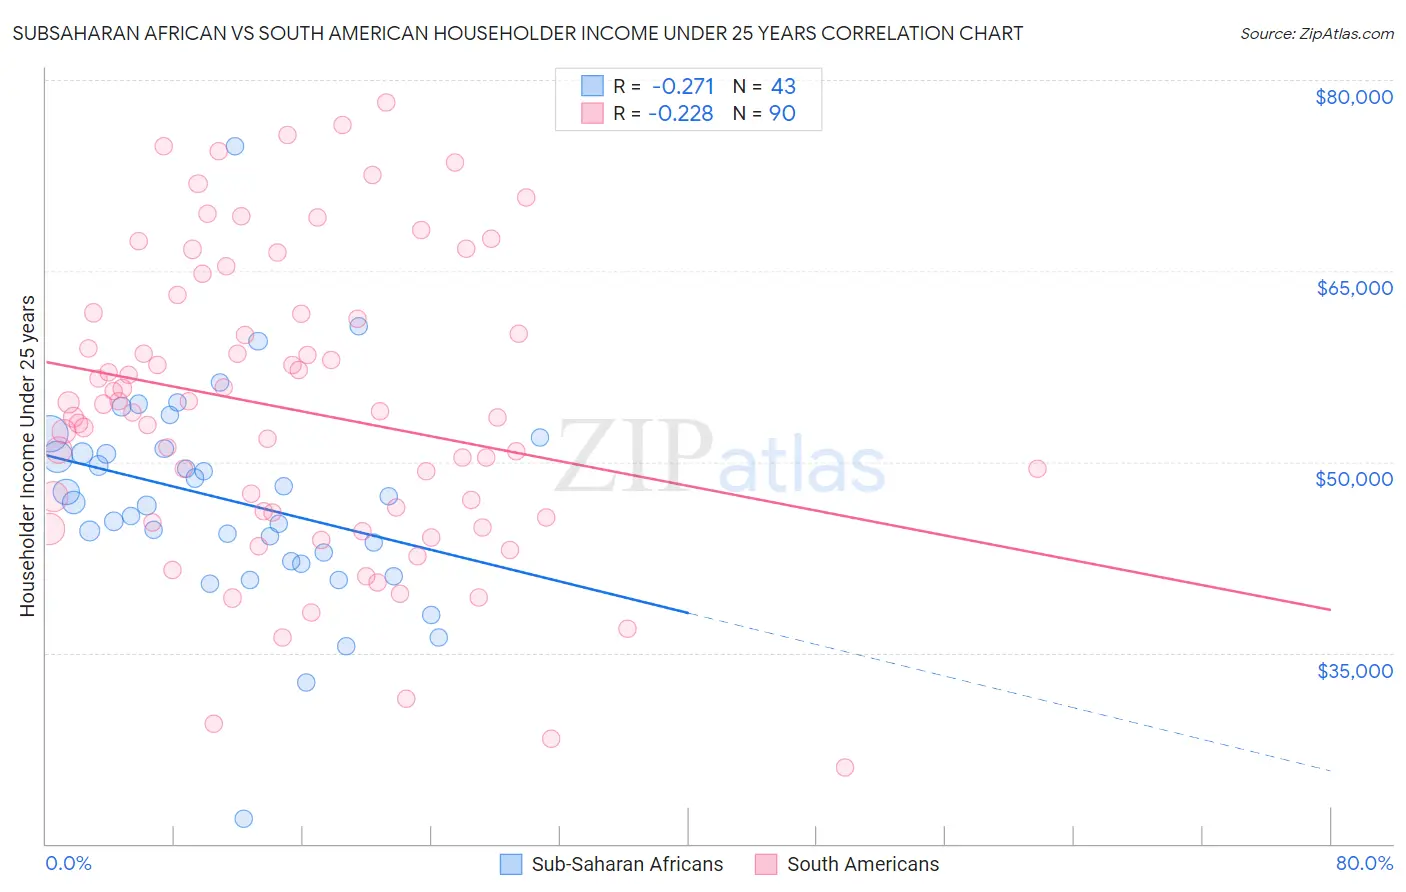
Subsaharan African vs South American Householder Income Under 25 years Correlation Chart
The statistical analysis conducted on geographies consisting of 413,616,575 people shows a weak negative correlation between the proportion of Sub-Saharan Africans and household income with householder under the age of 25 in the United States with a correlation coefficient (R) of -0.271 and weighted average of $48,691. Similarly, the statistical analysis conducted on geographies consisting of 401,700,019 people shows a weak negative correlation between the proportion of South Americans and household income with householder under the age of 25 in the United States with a correlation coefficient (R) of -0.228 and weighted average of $53,939, a difference of 10.8%.
Householder Income Under 25 years Correlation Summary
| Measurement | Subsaharan African | South American |
| Minimum | $21,932 | $26,011 |
| Maximum | $74,779 | $78,265 |
| Range | $52,847 | $52,254 |
| Mean | $46,996 | $54,082 |
| Median | $46,794 | $53,957 |
| Interquartile 25% (IQ1) | $42,165 | $45,625 |
| Interquartile 75% (IQ3) | $51,035 | $61,659 |
| Interquartile Range (IQR) | $8,871 | $16,034 |
| Standard Deviation (Sample) | $8,415 | $11,713 |
| Standard Deviation (Population) | $8,316 | $11,648 |
Similar Demographics by Householder Income Under 25 years
Demographics Similar to Sub-Saharan Africans by Householder Income Under 25 years
In terms of householder income under 25 years, the demographic groups most similar to Sub-Saharan Africans are Shoshone ($48,720, a difference of 0.060%), Somali ($48,657, a difference of 0.070%), Central American Indian ($48,643, a difference of 0.10%), Immigrants from Burma/Myanmar ($48,749, a difference of 0.12%), and Blackfeet ($48,603, a difference of 0.18%).
| Demographics | Rating | Rank | Householder Income Under 25 years |
| French American Indians | 0.0 /100 | #286 | Tragic $48,977 |
| Senegalese | 0.0 /100 | #287 | Tragic $48,953 |
| Liberians | 0.0 /100 | #288 | Tragic $48,917 |
| Hondurans | 0.0 /100 | #289 | Tragic $48,885 |
| Americans | 0.0 /100 | #290 | Tragic $48,860 |
| Immigrants | Burma/Myanmar | 0.0 /100 | #291 | Tragic $48,749 |
| Shoshone | 0.0 /100 | #292 | Tragic $48,720 |
| Sub-Saharan Africans | 0.0 /100 | #293 | Tragic $48,691 |
| Somalis | 0.0 /100 | #294 | Tragic $48,657 |
| Central American Indians | 0.0 /100 | #295 | Tragic $48,643 |
| Blackfeet | 0.0 /100 | #296 | Tragic $48,603 |
| Cree | 0.0 /100 | #297 | Tragic $48,514 |
| Yaqui | 0.0 /100 | #298 | Tragic $48,300 |
| Immigrants | Honduras | 0.0 /100 | #299 | Tragic $48,267 |
| Immigrants | Somalia | 0.0 /100 | #300 | Tragic $48,135 |
Demographics Similar to South Americans by Householder Income Under 25 years
In terms of householder income under 25 years, the demographic groups most similar to South Americans are Ecuadorian ($53,911, a difference of 0.050%), Immigrants from Kazakhstan ($53,990, a difference of 0.090%), Alaska Native ($54,000, a difference of 0.11%), Ukrainian ($53,843, a difference of 0.18%), and Ethiopian ($53,818, a difference of 0.22%).
| Demographics | Rating | Rank | Householder Income Under 25 years |
| Immigrants | Sierra Leone | 99.3 /100 | #94 | Exceptional $54,190 |
| Immigrants | Malaysia | 99.2 /100 | #95 | Exceptional $54,179 |
| Argentineans | 99.2 /100 | #96 | Exceptional $54,154 |
| Immigrants | Portugal | 99.1 /100 | #97 | Exceptional $54,105 |
| Eastern Europeans | 99.0 /100 | #98 | Exceptional $54,066 |
| Alaska Natives | 98.8 /100 | #99 | Exceptional $54,000 |
| Immigrants | Kazakhstan | 98.8 /100 | #100 | Exceptional $53,990 |
| South Americans | 98.6 /100 | #101 | Exceptional $53,939 |
| Ecuadorians | 98.5 /100 | #102 | Exceptional $53,911 |
| Ukrainians | 98.3 /100 | #103 | Exceptional $53,843 |
| Ethiopians | 98.2 /100 | #104 | Exceptional $53,818 |
| Immigrants | France | 98.1 /100 | #105 | Exceptional $53,805 |
| Albanians | 98.1 /100 | #106 | Exceptional $53,794 |
| Australians | 97.8 /100 | #107 | Exceptional $53,739 |
| Maltese | 97.8 /100 | #108 | Exceptional $53,735 |