Subsaharan African vs Brazilian Householder Income Under 25 years
COMPARE
Subsaharan African
Brazilian
Householder Income Under 25 years
Householder Income Under 25 years Comparison
Sub-Saharan Africans
Brazilians
$48,691
HOUSEHOLDER INCOME UNDER 25 YEARS
0.0/ 100
METRIC RATING
293rd/ 347
METRIC RANK
$54,335
HOUSEHOLDER INCOME UNDER 25 YEARS
99.5/ 100
METRIC RATING
87th/ 347
METRIC RANK
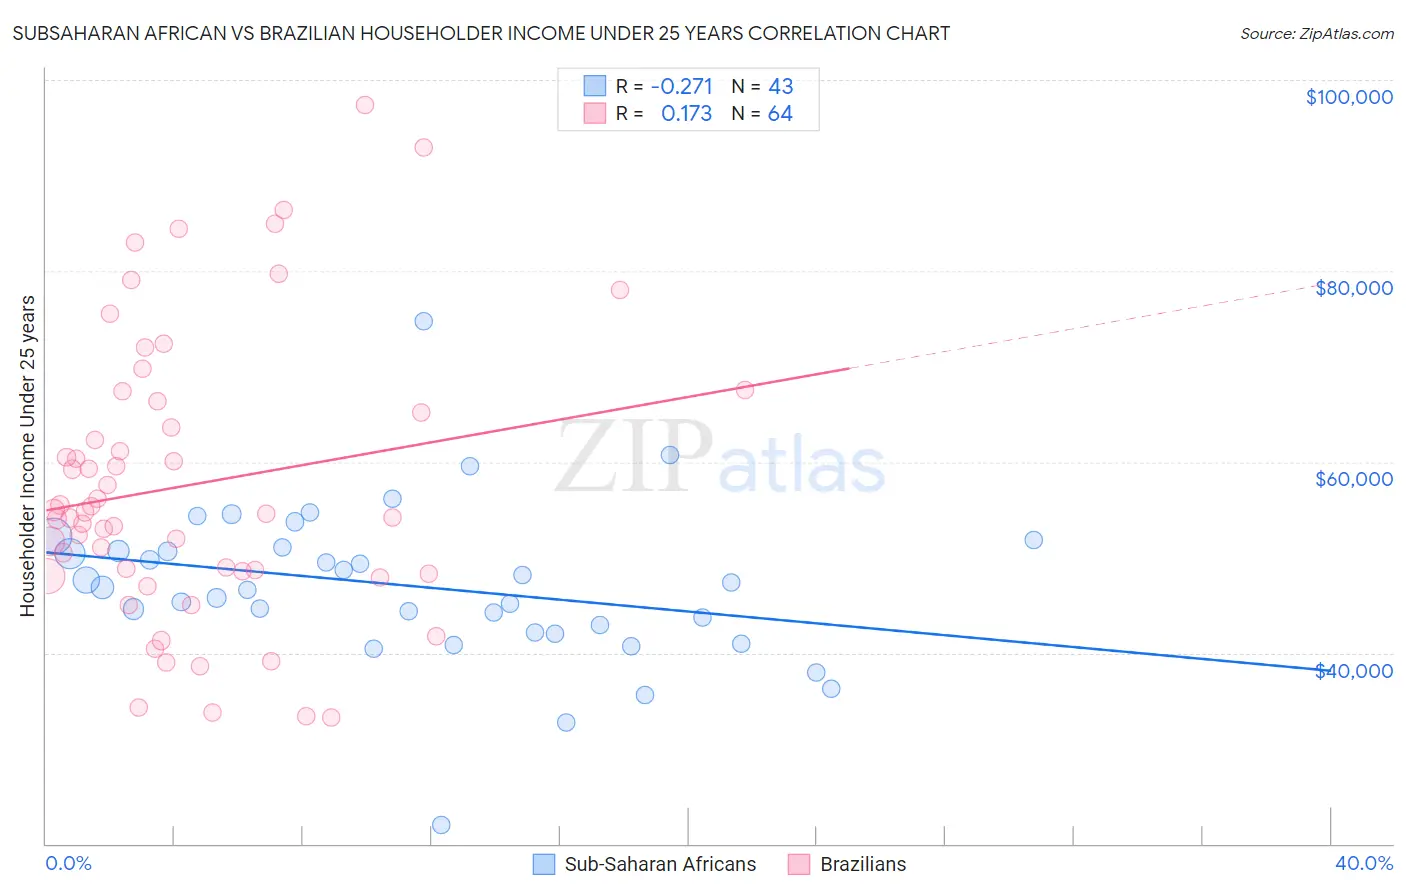
Subsaharan African vs Brazilian Householder Income Under 25 years Correlation Chart
The statistical analysis conducted on geographies consisting of 413,616,575 people shows a weak negative correlation between the proportion of Sub-Saharan Africans and household income with householder under the age of 25 in the United States with a correlation coefficient (R) of -0.271 and weighted average of $48,691. Similarly, the statistical analysis conducted on geographies consisting of 277,651,798 people shows a poor positive correlation between the proportion of Brazilians and household income with householder under the age of 25 in the United States with a correlation coefficient (R) of 0.173 and weighted average of $54,335, a difference of 11.6%.
Householder Income Under 25 years Correlation Summary
| Measurement | Subsaharan African | Brazilian |
| Minimum | $21,932 | $33,271 |
| Maximum | $74,779 | $97,399 |
| Range | $52,847 | $64,128 |
| Mean | $46,996 | $57,617 |
| Median | $46,794 | $54,675 |
| Interquartile 25% (IQ1) | $42,165 | $48,409 |
| Interquartile 75% (IQ3) | $51,035 | $65,785 |
| Interquartile Range (IQR) | $8,871 | $17,376 |
| Standard Deviation (Sample) | $8,415 | $14,874 |
| Standard Deviation (Population) | $8,316 | $14,757 |
Similar Demographics by Householder Income Under 25 years
Demographics Similar to Sub-Saharan Africans by Householder Income Under 25 years
In terms of householder income under 25 years, the demographic groups most similar to Sub-Saharan Africans are Shoshone ($48,720, a difference of 0.060%), Somali ($48,657, a difference of 0.070%), Central American Indian ($48,643, a difference of 0.10%), Immigrants from Burma/Myanmar ($48,749, a difference of 0.12%), and Blackfeet ($48,603, a difference of 0.18%).
| Demographics | Rating | Rank | Householder Income Under 25 years |
| French American Indians | 0.0 /100 | #286 | Tragic $48,977 |
| Senegalese | 0.0 /100 | #287 | Tragic $48,953 |
| Liberians | 0.0 /100 | #288 | Tragic $48,917 |
| Hondurans | 0.0 /100 | #289 | Tragic $48,885 |
| Americans | 0.0 /100 | #290 | Tragic $48,860 |
| Immigrants | Burma/Myanmar | 0.0 /100 | #291 | Tragic $48,749 |
| Shoshone | 0.0 /100 | #292 | Tragic $48,720 |
| Sub-Saharan Africans | 0.0 /100 | #293 | Tragic $48,691 |
| Somalis | 0.0 /100 | #294 | Tragic $48,657 |
| Central American Indians | 0.0 /100 | #295 | Tragic $48,643 |
| Blackfeet | 0.0 /100 | #296 | Tragic $48,603 |
| Cree | 0.0 /100 | #297 | Tragic $48,514 |
| Yaqui | 0.0 /100 | #298 | Tragic $48,300 |
| Immigrants | Honduras | 0.0 /100 | #299 | Tragic $48,267 |
| Immigrants | Somalia | 0.0 /100 | #300 | Tragic $48,135 |
Demographics Similar to Brazilians by Householder Income Under 25 years
In terms of householder income under 25 years, the demographic groups most similar to Brazilians are Immigrants from Croatia ($54,343, a difference of 0.020%), Bulgarian ($54,352, a difference of 0.030%), Immigrants from Czechoslovakia ($54,352, a difference of 0.030%), Yakama ($54,321, a difference of 0.030%), and Laotian ($54,369, a difference of 0.060%).
| Demographics | Rating | Rank | Householder Income Under 25 years |
| Egyptians | 99.6 /100 | #80 | Exceptional $54,444 |
| Portuguese | 99.6 /100 | #81 | Exceptional $54,436 |
| Russians | 99.5 /100 | #82 | Exceptional $54,389 |
| Laotians | 99.5 /100 | #83 | Exceptional $54,369 |
| Bulgarians | 99.5 /100 | #84 | Exceptional $54,352 |
| Immigrants | Czechoslovakia | 99.5 /100 | #85 | Exceptional $54,352 |
| Immigrants | Croatia | 99.5 /100 | #86 | Exceptional $54,343 |
| Brazilians | 99.5 /100 | #87 | Exceptional $54,335 |
| Yakama | 99.5 /100 | #88 | Exceptional $54,321 |
| Immigrants | South America | 99.4 /100 | #89 | Exceptional $54,268 |
| Turks | 99.4 /100 | #90 | Exceptional $54,266 |
| Immigrants | Egypt | 99.3 /100 | #91 | Exceptional $54,239 |
| Immigrants | St. Vincent and the Grenadines | 99.3 /100 | #92 | Exceptional $54,230 |
| Immigrants | Argentina | 99.3 /100 | #93 | Exceptional $54,209 |
| Immigrants | Sierra Leone | 99.3 /100 | #94 | Exceptional $54,190 |