Subsaharan African vs Immigrants from Liberia Householder Income Under 25 years
COMPARE
Subsaharan African
Immigrants from Liberia
Householder Income Under 25 years
Householder Income Under 25 years Comparison
Sub-Saharan Africans
Immigrants from Liberia
$48,691
HOUSEHOLDER INCOME UNDER 25 YEARS
0.0/ 100
METRIC RATING
293rd/ 347
METRIC RANK
$47,981
HOUSEHOLDER INCOME UNDER 25 YEARS
0.0/ 100
METRIC RATING
302nd/ 347
METRIC RANK
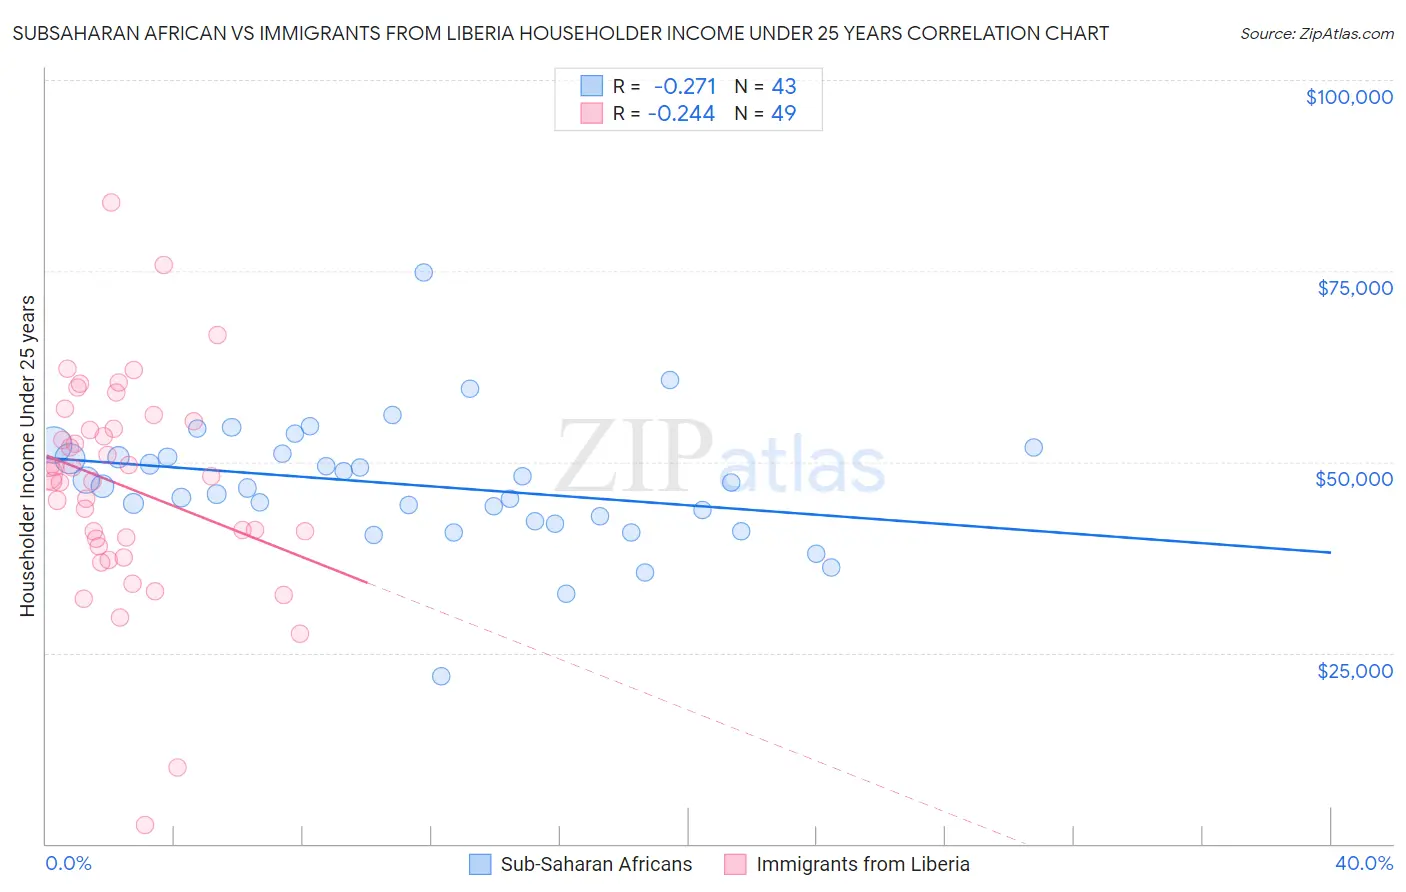
Subsaharan African vs Immigrants from Liberia Householder Income Under 25 years Correlation Chart
The statistical analysis conducted on geographies consisting of 413,616,575 people shows a weak negative correlation between the proportion of Sub-Saharan Africans and household income with householder under the age of 25 in the United States with a correlation coefficient (R) of -0.271 and weighted average of $48,691. Similarly, the statistical analysis conducted on geographies consisting of 125,997,994 people shows a weak negative correlation between the proportion of Immigrants from Liberia and household income with householder under the age of 25 in the United States with a correlation coefficient (R) of -0.244 and weighted average of $47,981, a difference of 1.5%.
Householder Income Under 25 years Correlation Summary
| Measurement | Subsaharan African | Immigrants from Liberia |
| Minimum | $21,932 | $2,499 |
| Maximum | $74,779 | $83,909 |
| Range | $52,847 | $81,410 |
| Mean | $46,996 | $46,823 |
| Median | $46,794 | $48,090 |
| Interquartile 25% (IQ1) | $42,165 | $39,377 |
| Interquartile 75% (IQ3) | $51,035 | $54,819 |
| Interquartile Range (IQR) | $8,871 | $15,443 |
| Standard Deviation (Sample) | $8,415 | $14,198 |
| Standard Deviation (Population) | $8,316 | $14,053 |
Demographics Similar to Sub-Saharan Africans and Immigrants from Liberia by Householder Income Under 25 years
In terms of householder income under 25 years, the demographic groups most similar to Sub-Saharan Africans are Shoshone ($48,720, a difference of 0.060%), Somali ($48,657, a difference of 0.070%), Central American Indian ($48,643, a difference of 0.10%), Immigrants from Burma/Myanmar ($48,749, a difference of 0.12%), and Blackfeet ($48,603, a difference of 0.18%). Similarly, the demographic groups most similar to Immigrants from Liberia are Immigrants from Middle Africa ($47,916, a difference of 0.14%), Menominee ($47,907, a difference of 0.15%), Cherokee ($47,848, a difference of 0.28%), Immigrants from Kuwait ($48,126, a difference of 0.30%), and Immigrants from Somalia ($48,135, a difference of 0.32%).
| Demographics | Rating | Rank | Householder Income Under 25 years |
| Senegalese | 0.0 /100 | #287 | Tragic $48,953 |
| Liberians | 0.0 /100 | #288 | Tragic $48,917 |
| Hondurans | 0.0 /100 | #289 | Tragic $48,885 |
| Americans | 0.0 /100 | #290 | Tragic $48,860 |
| Immigrants | Burma/Myanmar | 0.0 /100 | #291 | Tragic $48,749 |
| Shoshone | 0.0 /100 | #292 | Tragic $48,720 |
| Sub-Saharan Africans | 0.0 /100 | #293 | Tragic $48,691 |
| Somalis | 0.0 /100 | #294 | Tragic $48,657 |
| Central American Indians | 0.0 /100 | #295 | Tragic $48,643 |
| Blackfeet | 0.0 /100 | #296 | Tragic $48,603 |
| Cree | 0.0 /100 | #297 | Tragic $48,514 |
| Yaqui | 0.0 /100 | #298 | Tragic $48,300 |
| Immigrants | Honduras | 0.0 /100 | #299 | Tragic $48,267 |
| Immigrants | Somalia | 0.0 /100 | #300 | Tragic $48,135 |
| Immigrants | Kuwait | 0.0 /100 | #301 | Tragic $48,126 |
| Immigrants | Liberia | 0.0 /100 | #302 | Tragic $47,981 |
| Immigrants | Middle Africa | 0.0 /100 | #303 | Tragic $47,916 |
| Menominee | 0.0 /100 | #304 | Tragic $47,907 |
| Cherokee | 0.0 /100 | #305 | Tragic $47,848 |
| Natives/Alaskans | 0.0 /100 | #306 | Tragic $47,704 |
| Bangladeshis | 0.0 /100 | #307 | Tragic $47,589 |