Immigrants from Saudi Arabia vs South American Householder Income Under 25 years
COMPARE
Immigrants from Saudi Arabia
South American
Householder Income Under 25 years
Householder Income Under 25 years Comparison
Immigrants from Saudi Arabia
South Americans
$46,187
HOUSEHOLDER INCOME UNDER 25 YEARS
0.0/ 100
METRIC RATING
323rd/ 347
METRIC RANK
$53,939
HOUSEHOLDER INCOME UNDER 25 YEARS
98.6/ 100
METRIC RATING
101st/ 347
METRIC RANK
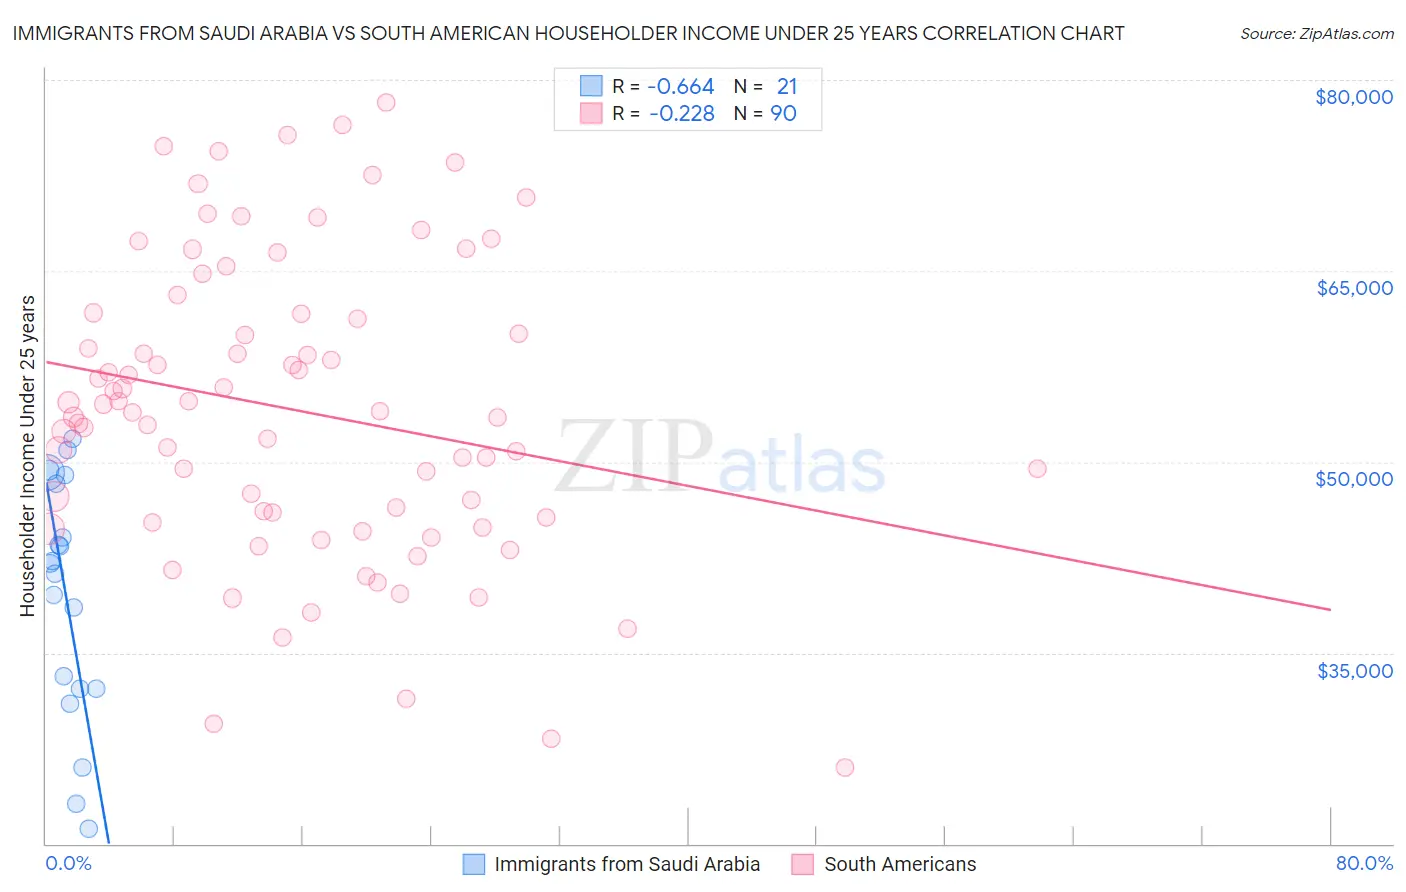
Immigrants from Saudi Arabia vs South American Householder Income Under 25 years Correlation Chart
The statistical analysis conducted on geographies consisting of 152,509,981 people shows a significant negative correlation between the proportion of Immigrants from Saudi Arabia and household income with householder under the age of 25 in the United States with a correlation coefficient (R) of -0.664 and weighted average of $46,187. Similarly, the statistical analysis conducted on geographies consisting of 401,700,019 people shows a weak negative correlation between the proportion of South Americans and household income with householder under the age of 25 in the United States with a correlation coefficient (R) of -0.228 and weighted average of $53,939, a difference of 16.8%.
Householder Income Under 25 years Correlation Summary
| Measurement | Immigrants from Saudi Arabia | South American |
| Minimum | $21,200 | $26,011 |
| Maximum | $51,786 | $78,265 |
| Range | $30,586 | $52,254 |
| Mean | $39,611 | $54,082 |
| Median | $42,009 | $53,957 |
| Interquartile 25% (IQ1) | $32,174 | $45,625 |
| Interquartile 75% (IQ3) | $48,671 | $61,659 |
| Interquartile Range (IQR) | $16,497 | $16,034 |
| Standard Deviation (Sample) | $9,248 | $11,713 |
| Standard Deviation (Population) | $9,026 | $11,648 |
Similar Demographics by Householder Income Under 25 years
Demographics Similar to Immigrants from Saudi Arabia by Householder Income Under 25 years
In terms of householder income under 25 years, the demographic groups most similar to Immigrants from Saudi Arabia are Sioux ($46,417, a difference of 0.50%), Potawatomi ($46,462, a difference of 0.60%), Dutch West Indian ($45,816, a difference of 0.81%), Immigrants from Bahamas ($45,793, a difference of 0.86%), and Osage ($45,764, a difference of 0.92%).
| Demographics | Rating | Rank | Householder Income Under 25 years |
| Sudanese | 0.0 /100 | #316 | Tragic $46,982 |
| Hopi | 0.0 /100 | #317 | Tragic $46,978 |
| Spanish Americans | 0.0 /100 | #318 | Tragic $46,913 |
| Africans | 0.0 /100 | #319 | Tragic $46,838 |
| Immigrants | Sudan | 0.0 /100 | #320 | Tragic $46,791 |
| Potawatomi | 0.0 /100 | #321 | Tragic $46,462 |
| Sioux | 0.0 /100 | #322 | Tragic $46,417 |
| Immigrants | Saudi Arabia | 0.0 /100 | #323 | Tragic $46,187 |
| Dutch West Indians | 0.0 /100 | #324 | Tragic $45,816 |
| Immigrants | Bahamas | 0.0 /100 | #325 | Tragic $45,793 |
| Osage | 0.0 /100 | #326 | Tragic $45,764 |
| Bahamians | 0.0 /100 | #327 | Tragic $45,743 |
| German Russians | 0.0 /100 | #328 | Tragic $45,673 |
| Seminole | 0.0 /100 | #329 | Tragic $45,649 |
| Indonesians | 0.0 /100 | #330 | Tragic $45,566 |
Demographics Similar to South Americans by Householder Income Under 25 years
In terms of householder income under 25 years, the demographic groups most similar to South Americans are Ecuadorian ($53,911, a difference of 0.050%), Immigrants from Kazakhstan ($53,990, a difference of 0.090%), Alaska Native ($54,000, a difference of 0.11%), Ukrainian ($53,843, a difference of 0.18%), and Ethiopian ($53,818, a difference of 0.22%).
| Demographics | Rating | Rank | Householder Income Under 25 years |
| Immigrants | Sierra Leone | 99.3 /100 | #94 | Exceptional $54,190 |
| Immigrants | Malaysia | 99.2 /100 | #95 | Exceptional $54,179 |
| Argentineans | 99.2 /100 | #96 | Exceptional $54,154 |
| Immigrants | Portugal | 99.1 /100 | #97 | Exceptional $54,105 |
| Eastern Europeans | 99.0 /100 | #98 | Exceptional $54,066 |
| Alaska Natives | 98.8 /100 | #99 | Exceptional $54,000 |
| Immigrants | Kazakhstan | 98.8 /100 | #100 | Exceptional $53,990 |
| South Americans | 98.6 /100 | #101 | Exceptional $53,939 |
| Ecuadorians | 98.5 /100 | #102 | Exceptional $53,911 |
| Ukrainians | 98.3 /100 | #103 | Exceptional $53,843 |
| Ethiopians | 98.2 /100 | #104 | Exceptional $53,818 |
| Immigrants | France | 98.1 /100 | #105 | Exceptional $53,805 |
| Albanians | 98.1 /100 | #106 | Exceptional $53,794 |
| Australians | 97.8 /100 | #107 | Exceptional $53,739 |
| Maltese | 97.8 /100 | #108 | Exceptional $53,735 |