Yakama vs South American Householder Income Under 25 years
COMPARE
Yakama
South American
Householder Income Under 25 years
Householder Income Under 25 years Comparison
Yakama
South Americans
$54,321
HOUSEHOLDER INCOME UNDER 25 YEARS
99.5/ 100
METRIC RATING
88th/ 347
METRIC RANK
$53,939
HOUSEHOLDER INCOME UNDER 25 YEARS
98.6/ 100
METRIC RATING
101st/ 347
METRIC RANK
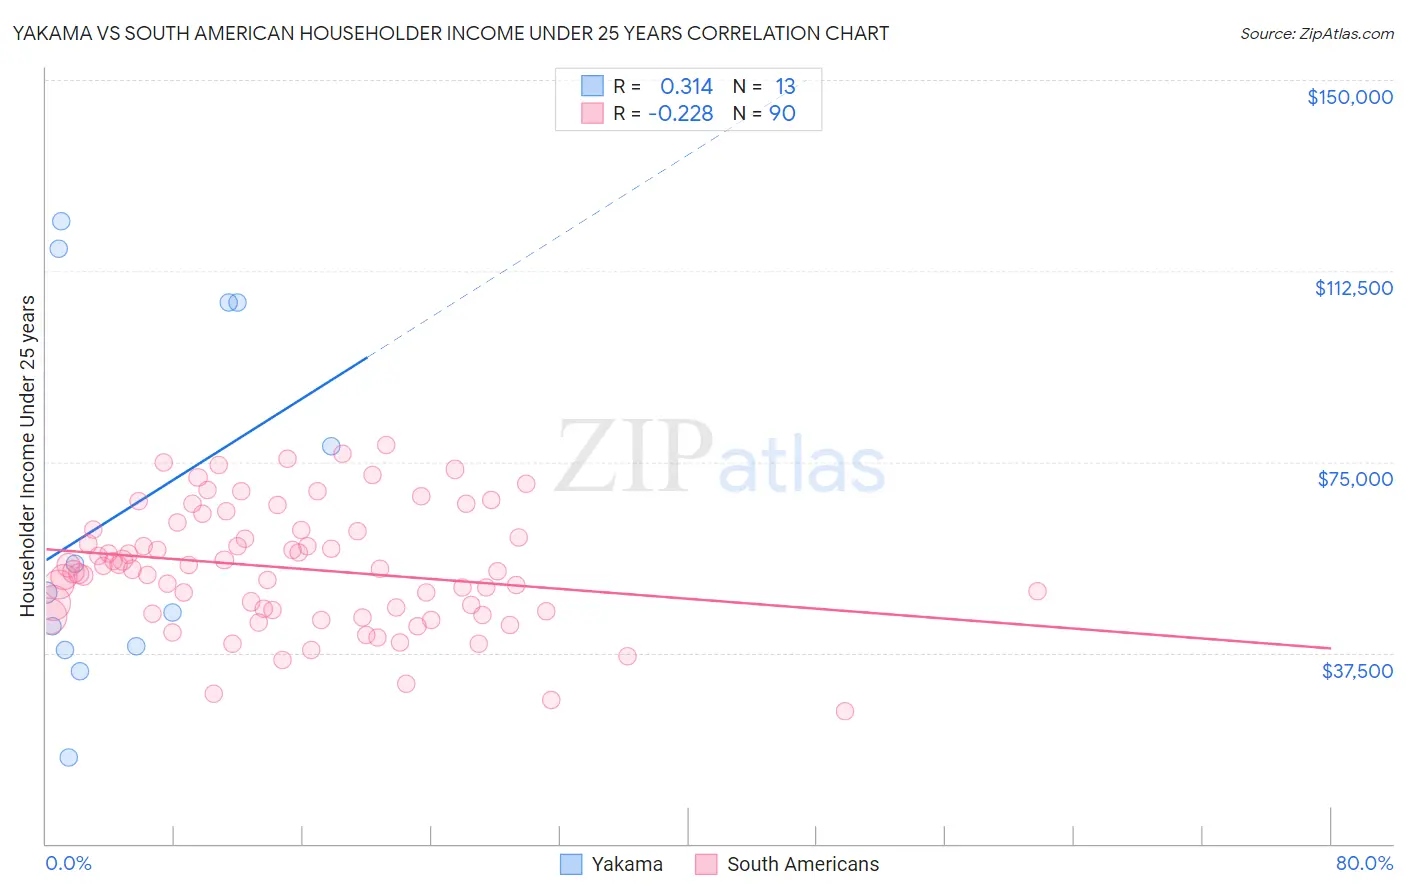
Yakama vs South American Householder Income Under 25 years Correlation Chart
The statistical analysis conducted on geographies consisting of 18,988,829 people shows a mild positive correlation between the proportion of Yakama and household income with householder under the age of 25 in the United States with a correlation coefficient (R) of 0.314 and weighted average of $54,321. Similarly, the statistical analysis conducted on geographies consisting of 401,700,019 people shows a weak negative correlation between the proportion of South Americans and household income with householder under the age of 25 in the United States with a correlation coefficient (R) of -0.228 and weighted average of $53,939, a difference of 0.71%.
Householder Income Under 25 years Correlation Summary
| Measurement | Yakama | South American |
| Minimum | $17,019 | $26,011 |
| Maximum | $122,325 | $78,265 |
| Range | $105,306 | $52,254 |
| Mean | $65,370 | $54,082 |
| Median | $49,297 | $53,957 |
| Interquartile 25% (IQ1) | $38,384 | $45,625 |
| Interquartile 75% (IQ3) | $106,250 | $61,659 |
| Interquartile Range (IQR) | $67,866 | $16,034 |
| Standard Deviation (Sample) | $35,875 | $11,713 |
| Standard Deviation (Population) | $34,468 | $11,648 |
Demographics Similar to Yakama and South Americans by Householder Income Under 25 years
In terms of householder income under 25 years, the demographic groups most similar to Yakama are Brazilian ($54,335, a difference of 0.030%), Immigrants from Croatia ($54,343, a difference of 0.040%), Bulgarian ($54,352, a difference of 0.060%), Immigrants from Czechoslovakia ($54,352, a difference of 0.060%), and Immigrants from South America ($54,268, a difference of 0.10%). Similarly, the demographic groups most similar to South Americans are Ecuadorian ($53,911, a difference of 0.050%), Immigrants from Kazakhstan ($53,990, a difference of 0.090%), Alaska Native ($54,000, a difference of 0.11%), Ukrainian ($53,843, a difference of 0.18%), and Ethiopian ($53,818, a difference of 0.22%).
| Demographics | Rating | Rank | Householder Income Under 25 years |
| Bulgarians | 99.5 /100 | #84 | Exceptional $54,352 |
| Immigrants | Czechoslovakia | 99.5 /100 | #85 | Exceptional $54,352 |
| Immigrants | Croatia | 99.5 /100 | #86 | Exceptional $54,343 |
| Brazilians | 99.5 /100 | #87 | Exceptional $54,335 |
| Yakama | 99.5 /100 | #88 | Exceptional $54,321 |
| Immigrants | South America | 99.4 /100 | #89 | Exceptional $54,268 |
| Turks | 99.4 /100 | #90 | Exceptional $54,266 |
| Immigrants | Egypt | 99.3 /100 | #91 | Exceptional $54,239 |
| Immigrants | St. Vincent and the Grenadines | 99.3 /100 | #92 | Exceptional $54,230 |
| Immigrants | Argentina | 99.3 /100 | #93 | Exceptional $54,209 |
| Immigrants | Sierra Leone | 99.3 /100 | #94 | Exceptional $54,190 |
| Immigrants | Malaysia | 99.2 /100 | #95 | Exceptional $54,179 |
| Argentineans | 99.2 /100 | #96 | Exceptional $54,154 |
| Immigrants | Portugal | 99.1 /100 | #97 | Exceptional $54,105 |
| Eastern Europeans | 99.0 /100 | #98 | Exceptional $54,066 |
| Alaska Natives | 98.8 /100 | #99 | Exceptional $54,000 |
| Immigrants | Kazakhstan | 98.8 /100 | #100 | Exceptional $53,990 |
| South Americans | 98.6 /100 | #101 | Exceptional $53,939 |
| Ecuadorians | 98.5 /100 | #102 | Exceptional $53,911 |
| Ukrainians | 98.3 /100 | #103 | Exceptional $53,843 |
| Ethiopians | 98.2 /100 | #104 | Exceptional $53,818 |