Subsaharan African vs Polish Householder Income Under 25 years
COMPARE
Subsaharan African
Polish
Householder Income Under 25 years
Householder Income Under 25 years Comparison
Sub-Saharan Africans
Poles
$48,691
HOUSEHOLDER INCOME UNDER 25 YEARS
0.0/ 100
METRIC RATING
293rd/ 347
METRIC RANK
$52,407
HOUSEHOLDER INCOME UNDER 25 YEARS
63.0/ 100
METRIC RATING
165th/ 347
METRIC RANK
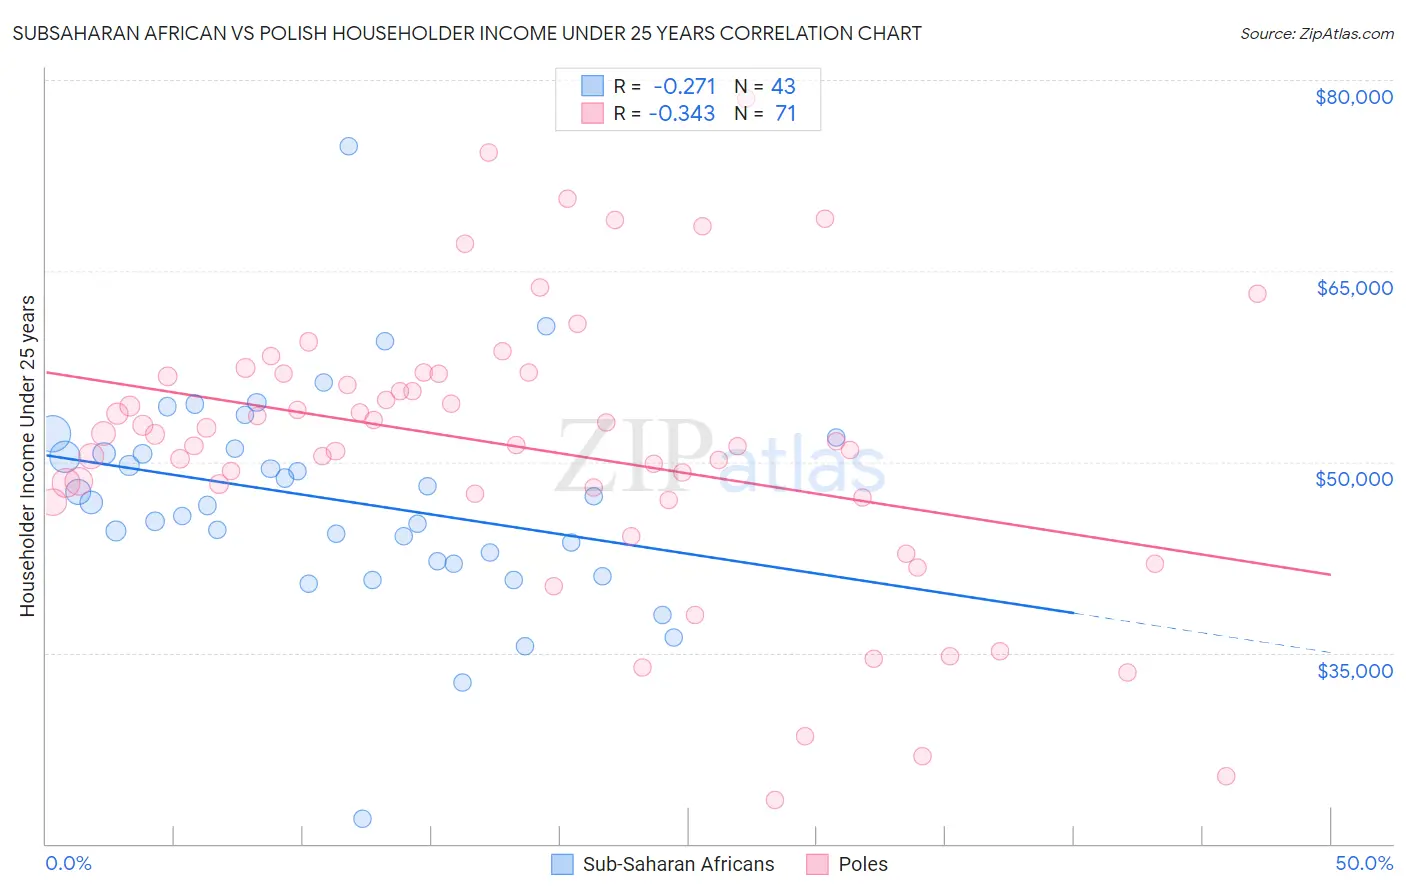
Subsaharan African vs Polish Householder Income Under 25 years Correlation Chart
The statistical analysis conducted on geographies consisting of 413,616,575 people shows a weak negative correlation between the proportion of Sub-Saharan Africans and household income with householder under the age of 25 in the United States with a correlation coefficient (R) of -0.271 and weighted average of $48,691. Similarly, the statistical analysis conducted on geographies consisting of 433,901,695 people shows a mild negative correlation between the proportion of Poles and household income with householder under the age of 25 in the United States with a correlation coefficient (R) of -0.343 and weighted average of $52,407, a difference of 7.6%.
Householder Income Under 25 years Correlation Summary
| Measurement | Subsaharan African | Polish |
| Minimum | $21,932 | $23,462 |
| Maximum | $74,779 | $78,571 |
| Range | $52,847 | $55,109 |
| Mean | $46,996 | $51,111 |
| Median | $46,794 | $51,592 |
| Interquartile 25% (IQ1) | $42,165 | $47,153 |
| Interquartile 75% (IQ3) | $51,035 | $56,895 |
| Interquartile Range (IQR) | $8,871 | $9,742 |
| Standard Deviation (Sample) | $8,415 | $10,979 |
| Standard Deviation (Population) | $8,316 | $10,902 |
Similar Demographics by Householder Income Under 25 years
Demographics Similar to Sub-Saharan Africans by Householder Income Under 25 years
In terms of householder income under 25 years, the demographic groups most similar to Sub-Saharan Africans are Shoshone ($48,720, a difference of 0.060%), Somali ($48,657, a difference of 0.070%), Central American Indian ($48,643, a difference of 0.10%), Immigrants from Burma/Myanmar ($48,749, a difference of 0.12%), and Blackfeet ($48,603, a difference of 0.18%).
| Demographics | Rating | Rank | Householder Income Under 25 years |
| French American Indians | 0.0 /100 | #286 | Tragic $48,977 |
| Senegalese | 0.0 /100 | #287 | Tragic $48,953 |
| Liberians | 0.0 /100 | #288 | Tragic $48,917 |
| Hondurans | 0.0 /100 | #289 | Tragic $48,885 |
| Americans | 0.0 /100 | #290 | Tragic $48,860 |
| Immigrants | Burma/Myanmar | 0.0 /100 | #291 | Tragic $48,749 |
| Shoshone | 0.0 /100 | #292 | Tragic $48,720 |
| Sub-Saharan Africans | 0.0 /100 | #293 | Tragic $48,691 |
| Somalis | 0.0 /100 | #294 | Tragic $48,657 |
| Central American Indians | 0.0 /100 | #295 | Tragic $48,643 |
| Blackfeet | 0.0 /100 | #296 | Tragic $48,603 |
| Cree | 0.0 /100 | #297 | Tragic $48,514 |
| Yaqui | 0.0 /100 | #298 | Tragic $48,300 |
| Immigrants | Honduras | 0.0 /100 | #299 | Tragic $48,267 |
| Immigrants | Somalia | 0.0 /100 | #300 | Tragic $48,135 |
Demographics Similar to Poles by Householder Income Under 25 years
In terms of householder income under 25 years, the demographic groups most similar to Poles are Immigrants from Austria ($52,400, a difference of 0.010%), Immigrants from Chile ($52,440, a difference of 0.060%), Immigrants from Trinidad and Tobago ($52,437, a difference of 0.060%), Immigrants from Uganda ($52,374, a difference of 0.060%), and Immigrants from Cambodia ($52,450, a difference of 0.080%).
| Demographics | Rating | Rank | Householder Income Under 25 years |
| Immigrants | Netherlands | 72.8 /100 | #158 | Good $52,592 |
| Mongolians | 70.2 /100 | #159 | Good $52,540 |
| Immigrants | Turkey | 68.3 /100 | #160 | Good $52,503 |
| Uruguayans | 66.2 /100 | #161 | Good $52,465 |
| Immigrants | Cambodia | 65.4 /100 | #162 | Good $52,450 |
| Immigrants | Chile | 64.8 /100 | #163 | Good $52,440 |
| Immigrants | Trinidad and Tobago | 64.7 /100 | #164 | Good $52,437 |
| Poles | 63.0 /100 | #165 | Good $52,407 |
| Immigrants | Austria | 62.6 /100 | #166 | Good $52,400 |
| Immigrants | Uganda | 61.1 /100 | #167 | Good $52,374 |
| Japanese | 60.5 /100 | #168 | Good $52,365 |
| Canadians | 58.8 /100 | #169 | Average $52,336 |
| Israelis | 58.8 /100 | #170 | Average $52,335 |
| Immigrants | Uruguay | 56.8 /100 | #171 | Average $52,302 |
| Cypriots | 51.2 /100 | #172 | Average $52,209 |