Indonesian vs South American Householder Income Under 25 years
COMPARE
Indonesian
South American
Householder Income Under 25 years
Householder Income Under 25 years Comparison
Indonesians
South Americans
$45,566
HOUSEHOLDER INCOME UNDER 25 YEARS
0.0/ 100
METRIC RATING
330th/ 347
METRIC RANK
$53,939
HOUSEHOLDER INCOME UNDER 25 YEARS
98.6/ 100
METRIC RATING
101st/ 347
METRIC RANK
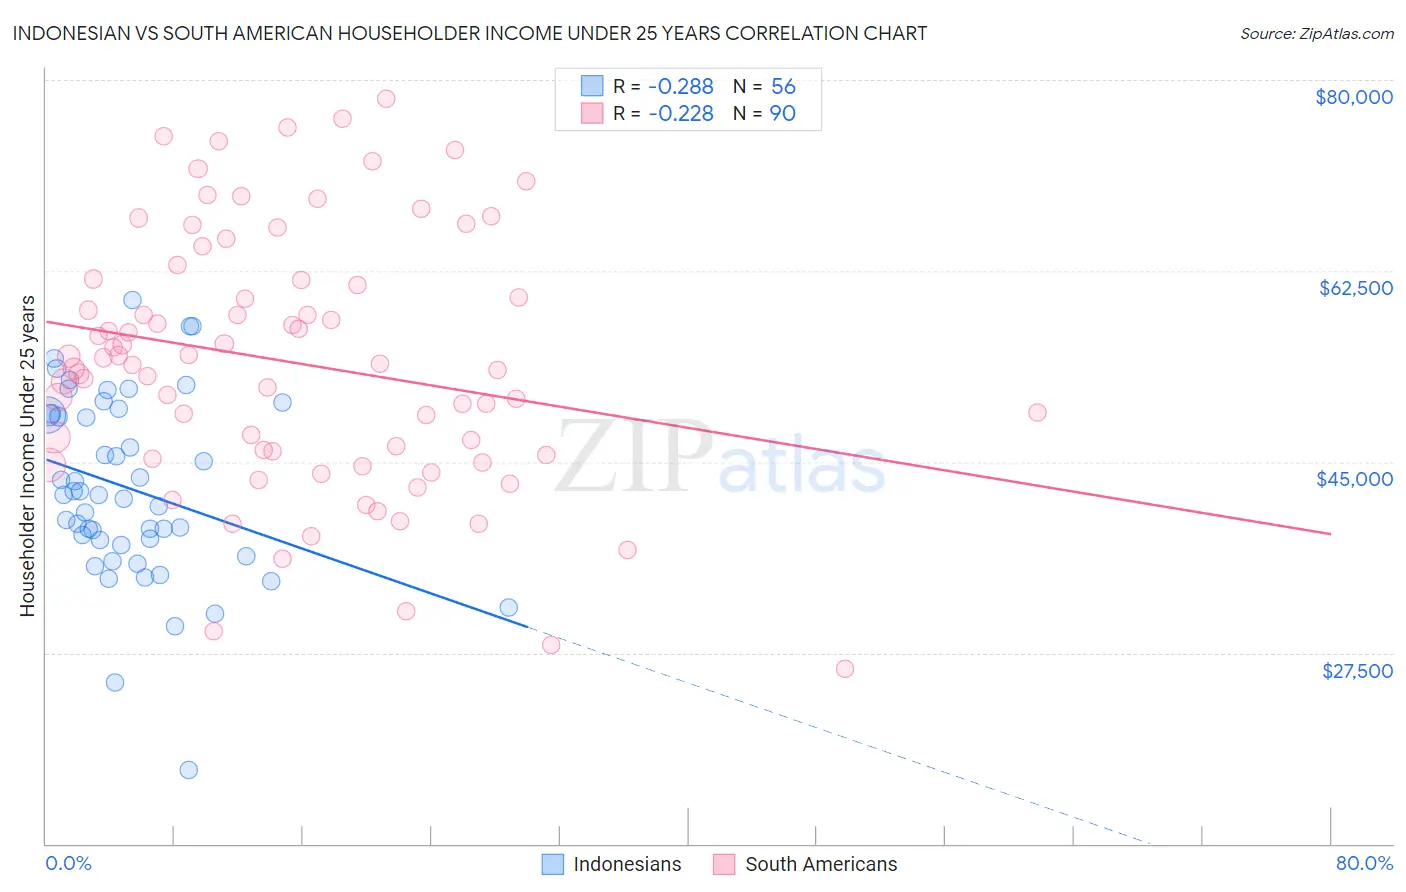
Indonesian vs South American Householder Income Under 25 years Correlation Chart
The statistical analysis conducted on geographies consisting of 151,007,148 people shows a weak negative correlation between the proportion of Indonesians and household income with householder under the age of 25 in the United States with a correlation coefficient (R) of -0.288 and weighted average of $45,566. Similarly, the statistical analysis conducted on geographies consisting of 401,700,019 people shows a weak negative correlation between the proportion of South Americans and household income with householder under the age of 25 in the United States with a correlation coefficient (R) of -0.228 and weighted average of $53,939, a difference of 18.4%.
Householder Income Under 25 years Correlation Summary
| Measurement | Indonesian | South American |
| Minimum | $16,806 | $26,011 |
| Maximum | $59,867 | $78,265 |
| Range | $43,061 | $52,254 |
| Mean | $42,559 | $54,082 |
| Median | $41,985 | $53,957 |
| Interquartile 25% (IQ1) | $37,574 | $45,625 |
| Interquartile 75% (IQ3) | $49,366 | $61,659 |
| Interquartile Range (IQR) | $11,792 | $16,034 |
| Standard Deviation (Sample) | $8,431 | $11,713 |
| Standard Deviation (Population) | $8,355 | $11,648 |
Similar Demographics by Householder Income Under 25 years
Demographics Similar to Indonesians by Householder Income Under 25 years
In terms of householder income under 25 years, the demographic groups most similar to Indonesians are Immigrants from Zaire ($45,529, a difference of 0.080%), Seminole ($45,649, a difference of 0.18%), German Russian ($45,673, a difference of 0.23%), Choctaw ($45,450, a difference of 0.25%), and Bahamian ($45,743, a difference of 0.39%).
| Demographics | Rating | Rank | Householder Income Under 25 years |
| Immigrants | Saudi Arabia | 0.0 /100 | #323 | Tragic $46,187 |
| Dutch West Indians | 0.0 /100 | #324 | Tragic $45,816 |
| Immigrants | Bahamas | 0.0 /100 | #325 | Tragic $45,793 |
| Osage | 0.0 /100 | #326 | Tragic $45,764 |
| Bahamians | 0.0 /100 | #327 | Tragic $45,743 |
| German Russians | 0.0 /100 | #328 | Tragic $45,673 |
| Seminole | 0.0 /100 | #329 | Tragic $45,649 |
| Indonesians | 0.0 /100 | #330 | Tragic $45,566 |
| Immigrants | Zaire | 0.0 /100 | #331 | Tragic $45,529 |
| Choctaw | 0.0 /100 | #332 | Tragic $45,450 |
| Creek | 0.0 /100 | #333 | Tragic $45,371 |
| Cajuns | 0.0 /100 | #334 | Tragic $45,338 |
| Cheyenne | 0.0 /100 | #335 | Tragic $45,275 |
| Tohono O'odham | 0.0 /100 | #336 | Tragic $45,248 |
| Pueblo | 0.0 /100 | #337 | Tragic $45,018 |
Demographics Similar to South Americans by Householder Income Under 25 years
In terms of householder income under 25 years, the demographic groups most similar to South Americans are Ecuadorian ($53,911, a difference of 0.050%), Immigrants from Kazakhstan ($53,990, a difference of 0.090%), Alaska Native ($54,000, a difference of 0.11%), Ukrainian ($53,843, a difference of 0.18%), and Ethiopian ($53,818, a difference of 0.22%).
| Demographics | Rating | Rank | Householder Income Under 25 years |
| Immigrants | Sierra Leone | 99.3 /100 | #94 | Exceptional $54,190 |
| Immigrants | Malaysia | 99.2 /100 | #95 | Exceptional $54,179 |
| Argentineans | 99.2 /100 | #96 | Exceptional $54,154 |
| Immigrants | Portugal | 99.1 /100 | #97 | Exceptional $54,105 |
| Eastern Europeans | 99.0 /100 | #98 | Exceptional $54,066 |
| Alaska Natives | 98.8 /100 | #99 | Exceptional $54,000 |
| Immigrants | Kazakhstan | 98.8 /100 | #100 | Exceptional $53,990 |
| South Americans | 98.6 /100 | #101 | Exceptional $53,939 |
| Ecuadorians | 98.5 /100 | #102 | Exceptional $53,911 |
| Ukrainians | 98.3 /100 | #103 | Exceptional $53,843 |
| Ethiopians | 98.2 /100 | #104 | Exceptional $53,818 |
| Immigrants | France | 98.1 /100 | #105 | Exceptional $53,805 |
| Albanians | 98.1 /100 | #106 | Exceptional $53,794 |
| Australians | 97.8 /100 | #107 | Exceptional $53,739 |
| Maltese | 97.8 /100 | #108 | Exceptional $53,735 |