Subsaharan African vs Dutch Householder Income Under 25 years
COMPARE
Subsaharan African
Dutch
Householder Income Under 25 years
Householder Income Under 25 years Comparison
Sub-Saharan Africans
Dutch
$48,691
HOUSEHOLDER INCOME UNDER 25 YEARS
0.0/ 100
METRIC RATING
293rd/ 347
METRIC RANK
$51,265
HOUSEHOLDER INCOME UNDER 25 YEARS
9.4/ 100
METRIC RATING
213th/ 347
METRIC RANK
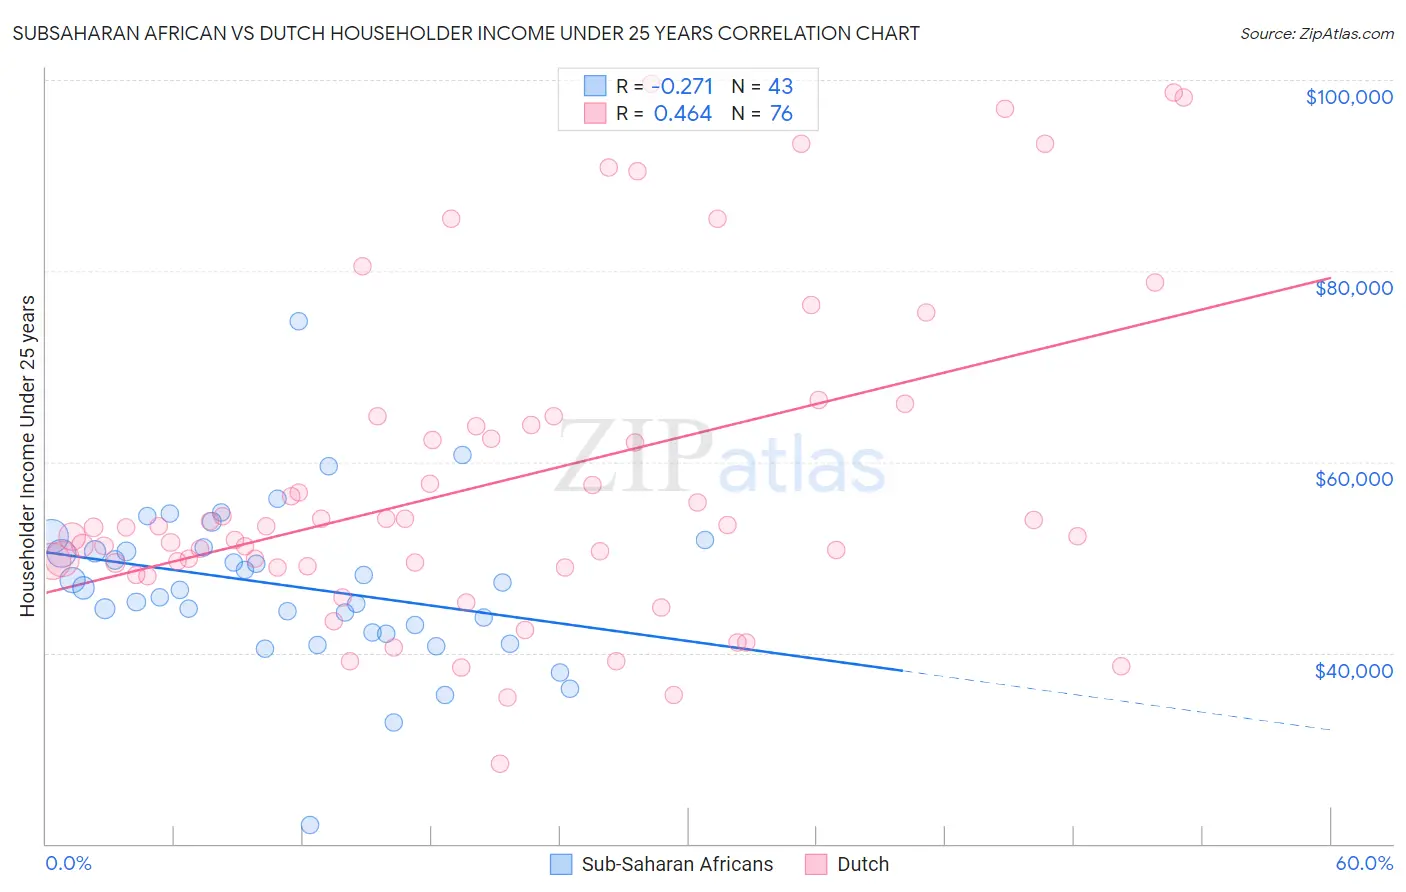
Subsaharan African vs Dutch Householder Income Under 25 years Correlation Chart
The statistical analysis conducted on geographies consisting of 413,616,575 people shows a weak negative correlation between the proportion of Sub-Saharan Africans and household income with householder under the age of 25 in the United States with a correlation coefficient (R) of -0.271 and weighted average of $48,691. Similarly, the statistical analysis conducted on geographies consisting of 431,004,830 people shows a moderate positive correlation between the proportion of Dutch and household income with householder under the age of 25 in the United States with a correlation coefficient (R) of 0.464 and weighted average of $51,265, a difference of 5.3%.
Householder Income Under 25 years Correlation Summary
| Measurement | Subsaharan African | Dutch |
| Minimum | $21,932 | $28,378 |
| Maximum | $74,779 | $99,620 |
| Range | $52,847 | $71,242 |
| Mean | $46,996 | $57,868 |
| Median | $46,794 | $53,119 |
| Interquartile 25% (IQ1) | $42,165 | $49,046 |
| Interquartile 75% (IQ3) | $51,035 | $63,833 |
| Interquartile Range (IQR) | $8,871 | $14,787 |
| Standard Deviation (Sample) | $8,415 | $16,885 |
| Standard Deviation (Population) | $8,316 | $16,773 |
Similar Demographics by Householder Income Under 25 years
Demographics Similar to Sub-Saharan Africans by Householder Income Under 25 years
In terms of householder income under 25 years, the demographic groups most similar to Sub-Saharan Africans are Shoshone ($48,720, a difference of 0.060%), Somali ($48,657, a difference of 0.070%), Central American Indian ($48,643, a difference of 0.10%), Immigrants from Burma/Myanmar ($48,749, a difference of 0.12%), and Blackfeet ($48,603, a difference of 0.18%).
| Demographics | Rating | Rank | Householder Income Under 25 years |
| French American Indians | 0.0 /100 | #286 | Tragic $48,977 |
| Senegalese | 0.0 /100 | #287 | Tragic $48,953 |
| Liberians | 0.0 /100 | #288 | Tragic $48,917 |
| Hondurans | 0.0 /100 | #289 | Tragic $48,885 |
| Americans | 0.0 /100 | #290 | Tragic $48,860 |
| Immigrants | Burma/Myanmar | 0.0 /100 | #291 | Tragic $48,749 |
| Shoshone | 0.0 /100 | #292 | Tragic $48,720 |
| Sub-Saharan Africans | 0.0 /100 | #293 | Tragic $48,691 |
| Somalis | 0.0 /100 | #294 | Tragic $48,657 |
| Central American Indians | 0.0 /100 | #295 | Tragic $48,643 |
| Blackfeet | 0.0 /100 | #296 | Tragic $48,603 |
| Cree | 0.0 /100 | #297 | Tragic $48,514 |
| Yaqui | 0.0 /100 | #298 | Tragic $48,300 |
| Immigrants | Honduras | 0.0 /100 | #299 | Tragic $48,267 |
| Immigrants | Somalia | 0.0 /100 | #300 | Tragic $48,135 |
Demographics Similar to Dutch by Householder Income Under 25 years
In terms of householder income under 25 years, the demographic groups most similar to Dutch are Zimbabwean ($51,259, a difference of 0.010%), Immigrants from Panama ($51,278, a difference of 0.030%), Icelander ($51,247, a difference of 0.030%), French ($51,230, a difference of 0.070%), and Czechoslovakian ($51,224, a difference of 0.080%).
| Demographics | Rating | Rank | Householder Income Under 25 years |
| Immigrants | Latin America | 12.3 /100 | #206 | Poor $51,387 |
| South Africans | 12.2 /100 | #207 | Poor $51,383 |
| Immigrants | Jordan | 11.9 /100 | #208 | Poor $51,370 |
| Syrians | 11.4 /100 | #209 | Poor $51,353 |
| Immigrants | Ghana | 10.9 /100 | #210 | Poor $51,333 |
| Irish | 10.6 /100 | #211 | Poor $51,317 |
| Immigrants | Panama | 9.7 /100 | #212 | Tragic $51,278 |
| Dutch | 9.4 /100 | #213 | Tragic $51,265 |
| Zimbabweans | 9.3 /100 | #214 | Tragic $51,259 |
| Icelanders | 9.1 /100 | #215 | Tragic $51,247 |
| French | 8.7 /100 | #216 | Tragic $51,230 |
| Czechoslovakians | 8.6 /100 | #217 | Tragic $51,224 |
| Immigrants | Belize | 8.6 /100 | #218 | Tragic $51,223 |
| Arabs | 8.5 /100 | #219 | Tragic $51,219 |
| Immigrants | Germany | 8.0 /100 | #220 | Tragic $51,190 |