Subsaharan African vs Immigrants from Nigeria Householder Income Under 25 years
COMPARE
Subsaharan African
Immigrants from Nigeria
Householder Income Under 25 years
Householder Income Under 25 years Comparison
Sub-Saharan Africans
Immigrants from Nigeria
$48,691
HOUSEHOLDER INCOME UNDER 25 YEARS
0.0/ 100
METRIC RATING
293rd/ 347
METRIC RANK
$49,174
HOUSEHOLDER INCOME UNDER 25 YEARS
0.1/ 100
METRIC RATING
283rd/ 347
METRIC RANK
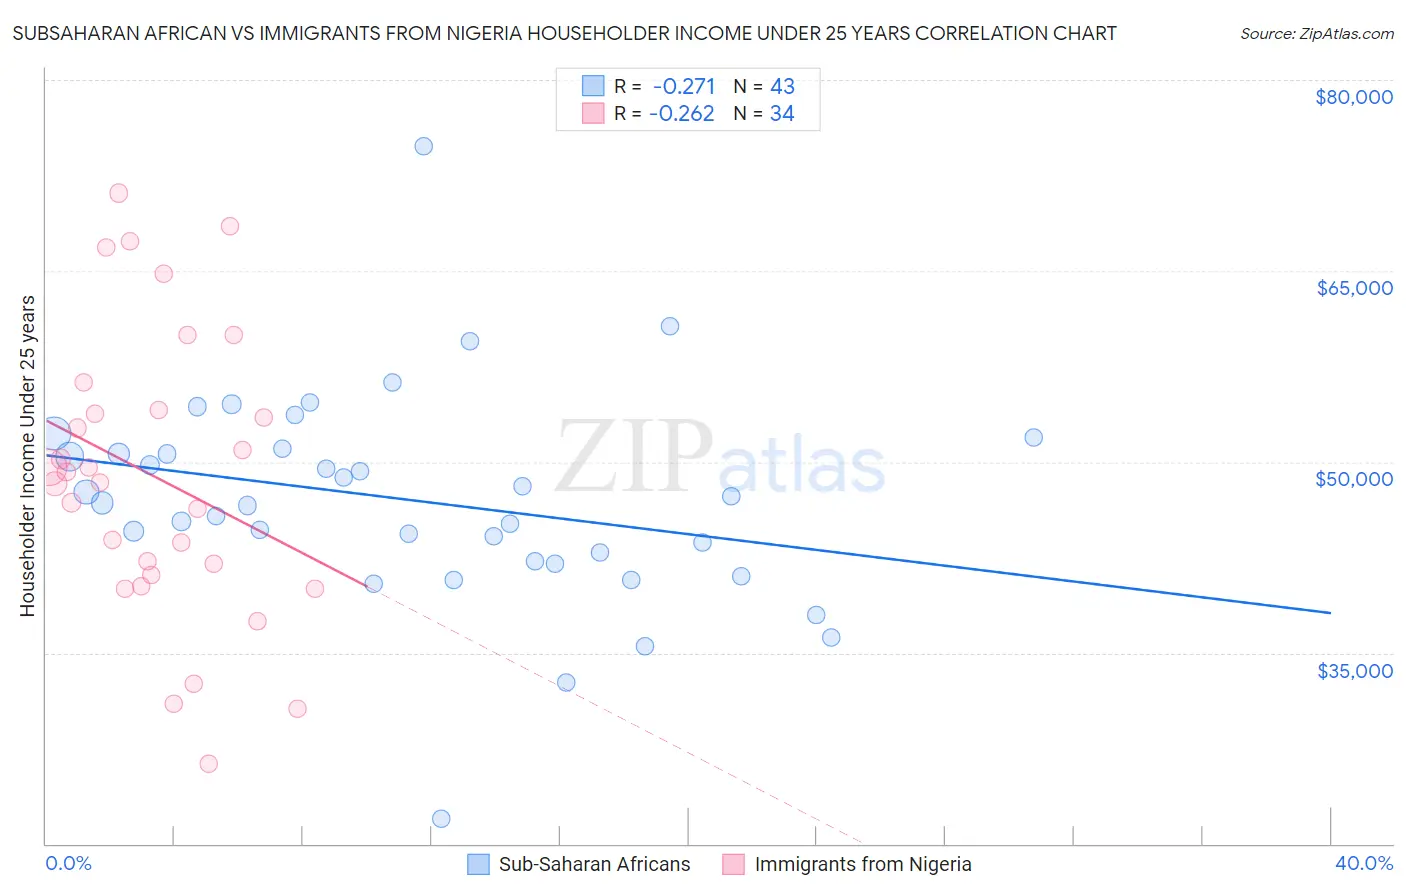
Subsaharan African vs Immigrants from Nigeria Householder Income Under 25 years Correlation Chart
The statistical analysis conducted on geographies consisting of 413,616,575 people shows a weak negative correlation between the proportion of Sub-Saharan Africans and household income with householder under the age of 25 in the United States with a correlation coefficient (R) of -0.271 and weighted average of $48,691. Similarly, the statistical analysis conducted on geographies consisting of 250,876,888 people shows a weak negative correlation between the proportion of Immigrants from Nigeria and household income with householder under the age of 25 in the United States with a correlation coefficient (R) of -0.262 and weighted average of $49,174, a difference of 0.99%.
Householder Income Under 25 years Correlation Summary
| Measurement | Subsaharan African | Immigrants from Nigeria |
| Minimum | $21,932 | $26,315 |
| Maximum | $74,779 | $71,114 |
| Range | $52,847 | $44,799 |
| Mean | $46,996 | $48,800 |
| Median | $46,794 | $48,781 |
| Interquartile 25% (IQ1) | $42,165 | $41,112 |
| Interquartile 75% (IQ3) | $51,035 | $54,053 |
| Interquartile Range (IQR) | $8,871 | $12,941 |
| Standard Deviation (Sample) | $8,415 | $11,278 |
| Standard Deviation (Population) | $8,316 | $11,111 |
Demographics Similar to Sub-Saharan Africans and Immigrants from Nigeria by Householder Income Under 25 years
In terms of householder income under 25 years, the demographic groups most similar to Sub-Saharan Africans are Shoshone ($48,720, a difference of 0.060%), Somali ($48,657, a difference of 0.070%), Central American Indian ($48,643, a difference of 0.10%), Immigrants from Burma/Myanmar ($48,749, a difference of 0.12%), and Blackfeet ($48,603, a difference of 0.18%). Similarly, the demographic groups most similar to Immigrants from Nigeria are Carpatho Rusyn ($49,113, a difference of 0.12%), Alsatian ($49,267, a difference of 0.19%), Scotch-Irish ($49,039, a difference of 0.28%), Nonimmigrants ($49,348, a difference of 0.35%), and Hmong ($49,364, a difference of 0.39%).
| Demographics | Rating | Rank | Householder Income Under 25 years |
| Nigerians | 0.1 /100 | #278 | Tragic $49,416 |
| Apache | 0.1 /100 | #279 | Tragic $49,395 |
| Hmong | 0.1 /100 | #280 | Tragic $49,364 |
| Immigrants | Nonimmigrants | 0.1 /100 | #281 | Tragic $49,348 |
| Alsatians | 0.1 /100 | #282 | Tragic $49,267 |
| Immigrants | Nigeria | 0.1 /100 | #283 | Tragic $49,174 |
| Carpatho Rusyns | 0.1 /100 | #284 | Tragic $49,113 |
| Scotch-Irish | 0.0 /100 | #285 | Tragic $49,039 |
| French American Indians | 0.0 /100 | #286 | Tragic $48,977 |
| Senegalese | 0.0 /100 | #287 | Tragic $48,953 |
| Liberians | 0.0 /100 | #288 | Tragic $48,917 |
| Hondurans | 0.0 /100 | #289 | Tragic $48,885 |
| Americans | 0.0 /100 | #290 | Tragic $48,860 |
| Immigrants | Burma/Myanmar | 0.0 /100 | #291 | Tragic $48,749 |
| Shoshone | 0.0 /100 | #292 | Tragic $48,720 |
| Sub-Saharan Africans | 0.0 /100 | #293 | Tragic $48,691 |
| Somalis | 0.0 /100 | #294 | Tragic $48,657 |
| Central American Indians | 0.0 /100 | #295 | Tragic $48,643 |
| Blackfeet | 0.0 /100 | #296 | Tragic $48,603 |
| Cree | 0.0 /100 | #297 | Tragic $48,514 |
| Yaqui | 0.0 /100 | #298 | Tragic $48,300 |