Spanish vs Colombian Divorced or Separated
COMPARE
Spanish
Colombian
Divorced or Separated
Divorced or Separated Comparison
Spanish
Colombians
12.8%
DIVORCED OR SEPARATED
0.1/ 100
METRIC RATING
286th/ 347
METRIC RANK
12.4%
DIVORCED OR SEPARATED
4.2/ 100
METRIC RATING
236th/ 347
METRIC RANK
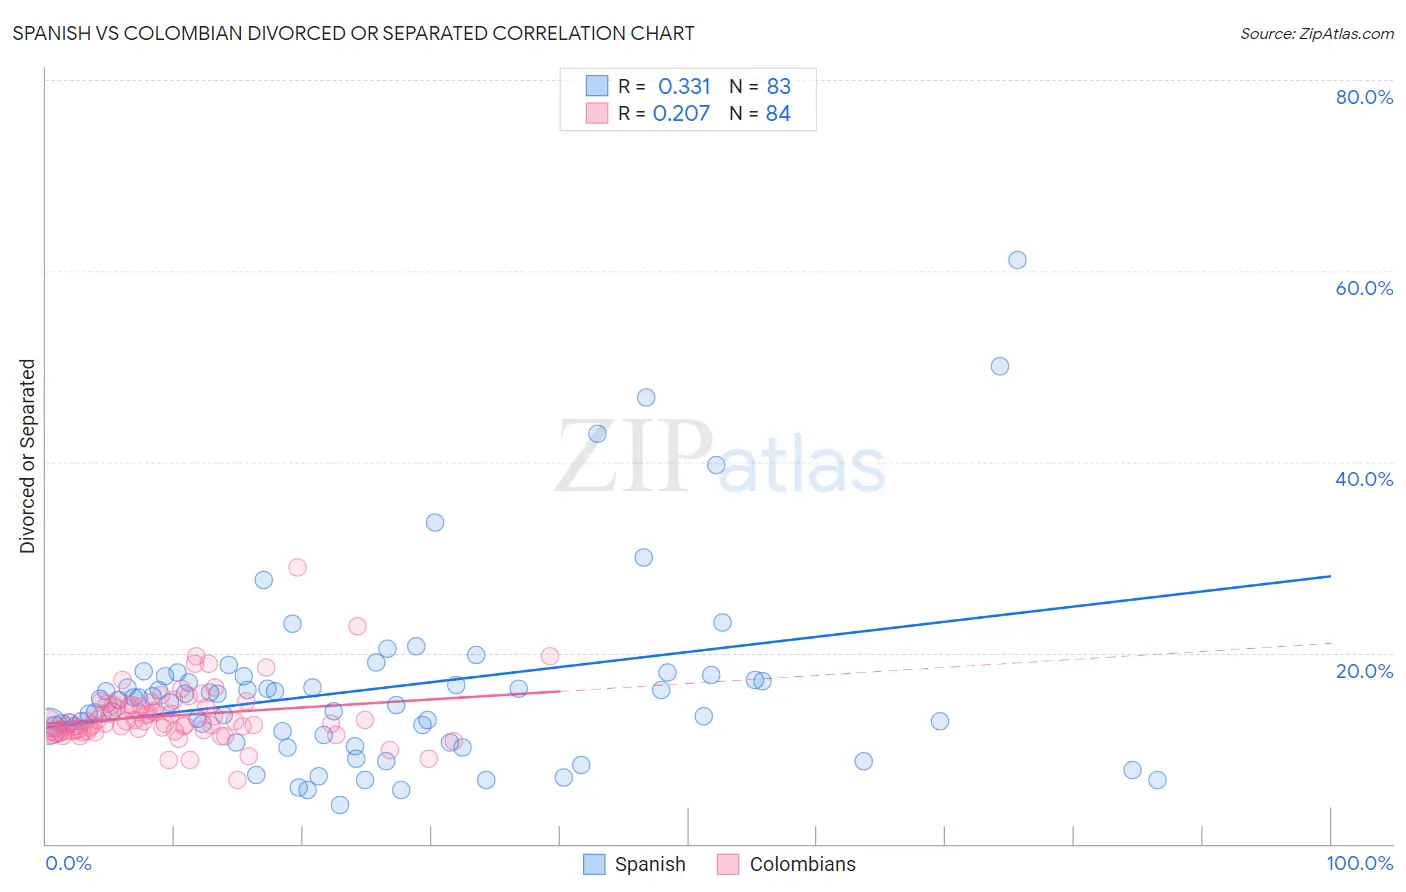
Spanish vs Colombian Divorced or Separated Correlation Chart
The statistical analysis conducted on geographies consisting of 422,013,877 people shows a mild positive correlation between the proportion of Spanish and percentage of population currently divorced or separated in the United States with a correlation coefficient (R) of 0.331 and weighted average of 12.8%. Similarly, the statistical analysis conducted on geographies consisting of 419,450,330 people shows a weak positive correlation between the proportion of Colombians and percentage of population currently divorced or separated in the United States with a correlation coefficient (R) of 0.207 and weighted average of 12.4%, a difference of 3.3%.
Divorced or Separated Correlation Summary
| Measurement | Spanish | Colombian |
| Minimum | 4.0% | 6.7% |
| Maximum | 61.2% | 28.9% |
| Range | 57.2% | 22.2% |
| Mean | 16.3% | 13.4% |
| Median | 15.1% | 12.6% |
| Interquartile 25% (IQ1) | 11.4% | 11.8% |
| Interquartile 75% (IQ3) | 17.6% | 14.5% |
| Interquartile Range (IQR) | 6.1% | 2.8% |
| Standard Deviation (Sample) | 9.8% | 3.1% |
| Standard Deviation (Population) | 9.7% | 3.1% |
Similar Demographics by Divorced or Separated
Demographics Similar to Spanish by Divorced or Separated
In terms of divorced or separated, the demographic groups most similar to Spanish are Honduran (12.8%, a difference of 0.19%), French (12.8%, a difference of 0.23%), Nonimmigrants (12.8%, a difference of 0.26%), Delaware (12.7%, a difference of 0.35%), and Subsaharan African (12.7%, a difference of 0.36%).
| Demographics | Rating | Rank | Divorced or Separated |
| Immigrants | Dominican Republic | 0.2 /100 | #279 | Tragic 12.7% |
| Immigrants | Zaire | 0.2 /100 | #280 | Tragic 12.7% |
| Pueblo | 0.2 /100 | #281 | Tragic 12.7% |
| Sub-Saharan Africans | 0.1 /100 | #282 | Tragic 12.7% |
| Delaware | 0.1 /100 | #283 | Tragic 12.7% |
| Immigrants | Nonimmigrants | 0.1 /100 | #284 | Tragic 12.8% |
| French | 0.1 /100 | #285 | Tragic 12.8% |
| Spanish | 0.1 /100 | #286 | Tragic 12.8% |
| Hondurans | 0.1 /100 | #287 | Tragic 12.8% |
| French Canadians | 0.1 /100 | #288 | Tragic 12.8% |
| Iroquois | 0.0 /100 | #289 | Tragic 12.9% |
| Pima | 0.0 /100 | #290 | Tragic 12.9% |
| Immigrants | Honduras | 0.0 /100 | #291 | Tragic 12.9% |
| Scotch-Irish | 0.0 /100 | #292 | Tragic 12.9% |
| Jamaicans | 0.0 /100 | #293 | Tragic 12.9% |
Demographics Similar to Colombians by Divorced or Separated
In terms of divorced or separated, the demographic groups most similar to Colombians are Immigrants from Laos (12.4%, a difference of 0.0%), Immigrants from Bosnia and Herzegovina (12.4%, a difference of 0.030%), West Indian (12.4%, a difference of 0.040%), Sudanese (12.4%, a difference of 0.040%), and Immigrants from Germany (12.4%, a difference of 0.040%).
| Demographics | Rating | Rank | Divorced or Separated |
| Immigrants | Sudan | 8.2 /100 | #229 | Tragic 12.3% |
| Yakama | 7.8 /100 | #230 | Tragic 12.3% |
| Yugoslavians | 6.6 /100 | #231 | Tragic 12.3% |
| Canadians | 5.3 /100 | #232 | Tragic 12.4% |
| Malaysians | 4.8 /100 | #233 | Tragic 12.4% |
| West Indians | 4.4 /100 | #234 | Tragic 12.4% |
| Immigrants | Bosnia and Herzegovina | 4.3 /100 | #235 | Tragic 12.4% |
| Colombians | 4.2 /100 | #236 | Tragic 12.4% |
| Immigrants | Laos | 4.2 /100 | #237 | Tragic 12.4% |
| Sudanese | 4.0 /100 | #238 | Tragic 12.4% |
| Immigrants | Germany | 4.0 /100 | #239 | Tragic 12.4% |
| British West Indians | 3.7 /100 | #240 | Tragic 12.4% |
| Uruguayans | 3.4 /100 | #241 | Tragic 12.4% |
| Dutch | 3.1 /100 | #242 | Tragic 12.4% |
| Immigrants | Latin America | 2.8 /100 | #243 | Tragic 12.4% |