Spaniard vs Hispanic or Latino Wage/Income Gap
COMPARE
Spaniard
Hispanic or Latino
Wage/Income Gap
Wage/Income Gap Comparison
Spaniards
Hispanics or Latinos
27.0%
WAGE/INCOME GAP
5.6/ 100
METRIC RATING
227th/ 347
METRIC RANK
24.9%
WAGE/INCOME GAP
89.5/ 100
METRIC RATING
139th/ 347
METRIC RANK
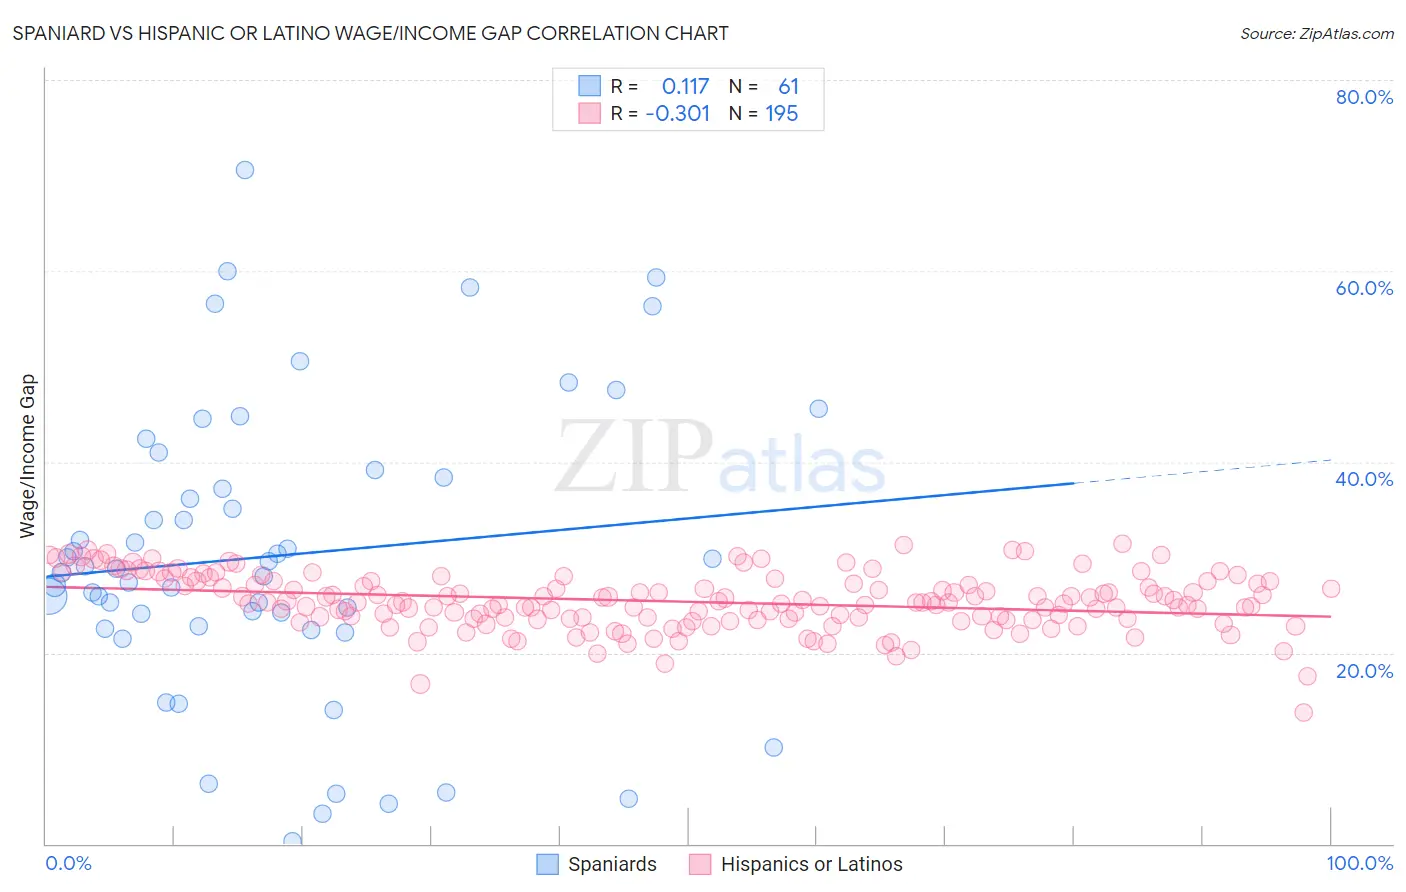
Spaniard vs Hispanic or Latino Wage/Income Gap Correlation Chart
The statistical analysis conducted on geographies consisting of 443,034,842 people shows a poor positive correlation between the proportion of Spaniards and wage/income gap percentage in the United States with a correlation coefficient (R) of 0.117 and weighted average of 27.0%. Similarly, the statistical analysis conducted on geographies consisting of 570,699,475 people shows a mild negative correlation between the proportion of Hispanics or Latinos and wage/income gap percentage in the United States with a correlation coefficient (R) of -0.301 and weighted average of 24.9%, a difference of 8.4%.
Wage/Income Gap Correlation Summary
| Measurement | Spaniard | Hispanic or Latino |
| Minimum | 0.29% | 13.7% |
| Maximum | 70.6% | 31.5% |
| Range | 70.3% | 17.8% |
| Mean | 30.2% | 25.4% |
| Median | 28.7% | 25.3% |
| Interquartile 25% (IQ1) | 22.7% | 23.6% |
| Interquartile 75% (IQ3) | 38.8% | 27.5% |
| Interquartile Range (IQR) | 16.1% | 3.9% |
| Standard Deviation (Sample) | 15.4% | 2.9% |
| Standard Deviation (Population) | 15.3% | 2.9% |
Similar Demographics by Wage/Income Gap
Demographics Similar to Spaniards by Wage/Income Gap
In terms of wage/income gap, the demographic groups most similar to Spaniards are Immigrants from Turkey (27.0%, a difference of 0.0%), Immigrants from Asia (27.0%, a difference of 0.040%), Asian (26.9%, a difference of 0.080%), Ottawa (27.0%, a difference of 0.090%), and Bhutanese (27.0%, a difference of 0.11%).
| Demographics | Rating | Rank | Wage/Income Gap |
| Immigrants | Latvia | 8.9 /100 | #220 | Tragic 26.7% |
| Immigrants | Spain | 8.5 /100 | #221 | Tragic 26.8% |
| Bolivians | 8.3 /100 | #222 | Tragic 26.8% |
| Jordanians | 8.0 /100 | #223 | Tragic 26.8% |
| Immigrants | Argentina | 7.2 /100 | #224 | Tragic 26.8% |
| Immigrants | Ireland | 6.5 /100 | #225 | Tragic 26.9% |
| Asians | 5.9 /100 | #226 | Tragic 26.9% |
| Spaniards | 5.6 /100 | #227 | Tragic 27.0% |
| Immigrants | Turkey | 5.6 /100 | #228 | Tragic 27.0% |
| Immigrants | Asia | 5.5 /100 | #229 | Tragic 27.0% |
| Ottawa | 5.3 /100 | #230 | Tragic 27.0% |
| Bhutanese | 5.3 /100 | #231 | Tragic 27.0% |
| Argentineans | 5.2 /100 | #232 | Tragic 27.0% |
| Immigrants | Brazil | 5.0 /100 | #233 | Tragic 27.0% |
| Immigrants | Pakistan | 4.9 /100 | #234 | Tragic 27.0% |
Demographics Similar to Hispanics or Latinos by Wage/Income Gap
In terms of wage/income gap, the demographic groups most similar to Hispanics or Latinos are Immigrants from Nepal (24.9%, a difference of 0.030%), Hawaiian (24.9%, a difference of 0.040%), Immigrants from Bosnia and Herzegovina (24.8%, a difference of 0.11%), Afghan (24.9%, a difference of 0.24%), and Immigrants from Uganda (24.9%, a difference of 0.25%).
| Demographics | Rating | Rank | Wage/Income Gap |
| Immigrants | Costa Rica | 92.4 /100 | #132 | Exceptional 24.7% |
| Colombians | 92.4 /100 | #133 | Exceptional 24.7% |
| Mexican American Indians | 92.2 /100 | #134 | Exceptional 24.7% |
| South American Indians | 92.0 /100 | #135 | Exceptional 24.7% |
| Armenians | 91.3 /100 | #136 | Exceptional 24.8% |
| Immigrants | South Eastern Asia | 90.9 /100 | #137 | Exceptional 24.8% |
| Immigrants | Bosnia and Herzegovina | 90.1 /100 | #138 | Exceptional 24.8% |
| Hispanics or Latinos | 89.5 /100 | #139 | Excellent 24.9% |
| Immigrants | Nepal | 89.3 /100 | #140 | Excellent 24.9% |
| Hawaiians | 89.3 /100 | #141 | Excellent 24.9% |
| Afghans | 88.1 /100 | #142 | Excellent 24.9% |
| Immigrants | Uganda | 88.0 /100 | #143 | Excellent 24.9% |
| Chippewa | 86.9 /100 | #144 | Excellent 25.0% |
| Comanche | 85.2 /100 | #145 | Excellent 25.0% |
| South Americans | 85.2 /100 | #146 | Excellent 25.0% |