Slavic vs Hispanic or Latino Wage/Income Gap
COMPARE
Slavic
Hispanic or Latino
Wage/Income Gap
Wage/Income Gap Comparison
Slavs
Hispanics or Latinos
27.4%
WAGE/INCOME GAP
1.8/ 100
METRIC RATING
258th/ 347
METRIC RANK
24.9%
WAGE/INCOME GAP
89.5/ 100
METRIC RATING
139th/ 347
METRIC RANK
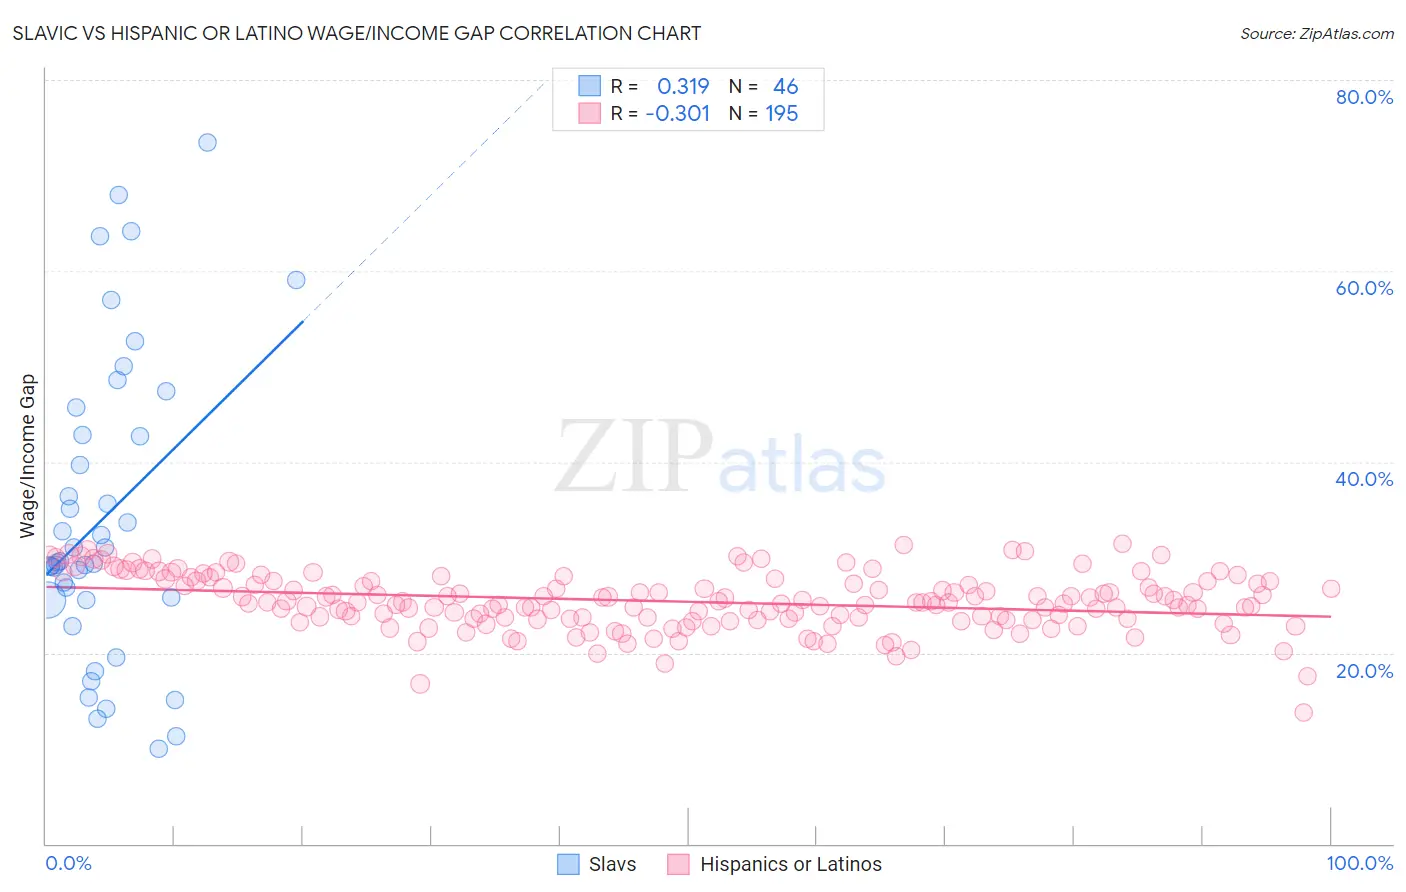
Slavic vs Hispanic or Latino Wage/Income Gap Correlation Chart
The statistical analysis conducted on geographies consisting of 270,754,650 people shows a mild positive correlation between the proportion of Slavs and wage/income gap percentage in the United States with a correlation coefficient (R) of 0.319 and weighted average of 27.4%. Similarly, the statistical analysis conducted on geographies consisting of 570,699,475 people shows a mild negative correlation between the proportion of Hispanics or Latinos and wage/income gap percentage in the United States with a correlation coefficient (R) of -0.301 and weighted average of 24.9%, a difference of 10.3%.
Wage/Income Gap Correlation Summary
| Measurement | Slavic | Hispanic or Latino |
| Minimum | 10.0% | 13.7% |
| Maximum | 73.5% | 31.5% |
| Range | 63.5% | 17.8% |
| Mean | 34.2% | 25.4% |
| Median | 29.5% | 25.3% |
| Interquartile 25% (IQ1) | 25.6% | 23.6% |
| Interquartile 75% (IQ3) | 42.9% | 27.5% |
| Interquartile Range (IQR) | 17.3% | 3.9% |
| Standard Deviation (Sample) | 15.7% | 2.9% |
| Standard Deviation (Population) | 15.5% | 2.9% |
Similar Demographics by Wage/Income Gap
Demographics Similar to Slavs by Wage/Income Gap
In terms of wage/income gap, the demographic groups most similar to Slavs are Luxembourger (27.4%, a difference of 0.040%), Icelander (27.5%, a difference of 0.080%), Cherokee (27.4%, a difference of 0.090%), Tongan (27.5%, a difference of 0.090%), and Immigrants from France (27.4%, a difference of 0.19%).
| Demographics | Rating | Rank | Wage/Income Gap |
| Immigrants | Norway | 2.5 /100 | #251 | Tragic 27.3% |
| Ukrainians | 2.4 /100 | #252 | Tragic 27.3% |
| Portuguese | 2.2 /100 | #253 | Tragic 27.4% |
| Israelis | 2.1 /100 | #254 | Tragic 27.4% |
| Immigrants | France | 2.1 /100 | #255 | Tragic 27.4% |
| Cherokee | 1.9 /100 | #256 | Tragic 27.4% |
| Luxembourgers | 1.9 /100 | #257 | Tragic 27.4% |
| Slavs | 1.8 /100 | #258 | Tragic 27.4% |
| Icelanders | 1.8 /100 | #259 | Tragic 27.5% |
| Tongans | 1.7 /100 | #260 | Tragic 27.5% |
| Immigrants | Germany | 1.5 /100 | #261 | Tragic 27.5% |
| Immigrants | Lebanon | 1.5 /100 | #262 | Tragic 27.5% |
| Syrians | 1.4 /100 | #263 | Tragic 27.6% |
| Immigrants | Switzerland | 1.0 /100 | #264 | Tragic 27.7% |
| Serbians | 1.0 /100 | #265 | Tragic 27.7% |
Demographics Similar to Hispanics or Latinos by Wage/Income Gap
In terms of wage/income gap, the demographic groups most similar to Hispanics or Latinos are Immigrants from Nepal (24.9%, a difference of 0.030%), Hawaiian (24.9%, a difference of 0.040%), Immigrants from Bosnia and Herzegovina (24.8%, a difference of 0.11%), Afghan (24.9%, a difference of 0.24%), and Immigrants from Uganda (24.9%, a difference of 0.25%).
| Demographics | Rating | Rank | Wage/Income Gap |
| Immigrants | Costa Rica | 92.4 /100 | #132 | Exceptional 24.7% |
| Colombians | 92.4 /100 | #133 | Exceptional 24.7% |
| Mexican American Indians | 92.2 /100 | #134 | Exceptional 24.7% |
| South American Indians | 92.0 /100 | #135 | Exceptional 24.7% |
| Armenians | 91.3 /100 | #136 | Exceptional 24.8% |
| Immigrants | South Eastern Asia | 90.9 /100 | #137 | Exceptional 24.8% |
| Immigrants | Bosnia and Herzegovina | 90.1 /100 | #138 | Exceptional 24.8% |
| Hispanics or Latinos | 89.5 /100 | #139 | Excellent 24.9% |
| Immigrants | Nepal | 89.3 /100 | #140 | Excellent 24.9% |
| Hawaiians | 89.3 /100 | #141 | Excellent 24.9% |
| Afghans | 88.1 /100 | #142 | Excellent 24.9% |
| Immigrants | Uganda | 88.0 /100 | #143 | Excellent 24.9% |
| Chippewa | 86.9 /100 | #144 | Excellent 25.0% |
| Comanche | 85.2 /100 | #145 | Excellent 25.0% |
| South Americans | 85.2 /100 | #146 | Excellent 25.0% |