Spaniard vs Trinidadian and Tobagonian Wage/Income Gap
COMPARE
Spaniard
Trinidadian and Tobagonian
Wage/Income Gap
Wage/Income Gap Comparison
Spaniards
Trinidadians and Tobagonians
27.0%
WAGE/INCOME GAP
5.6/ 100
METRIC RATING
227th/ 347
METRIC RANK
19.3%
WAGE/INCOME GAP
100.0/ 100
METRIC RATING
13th/ 347
METRIC RANK
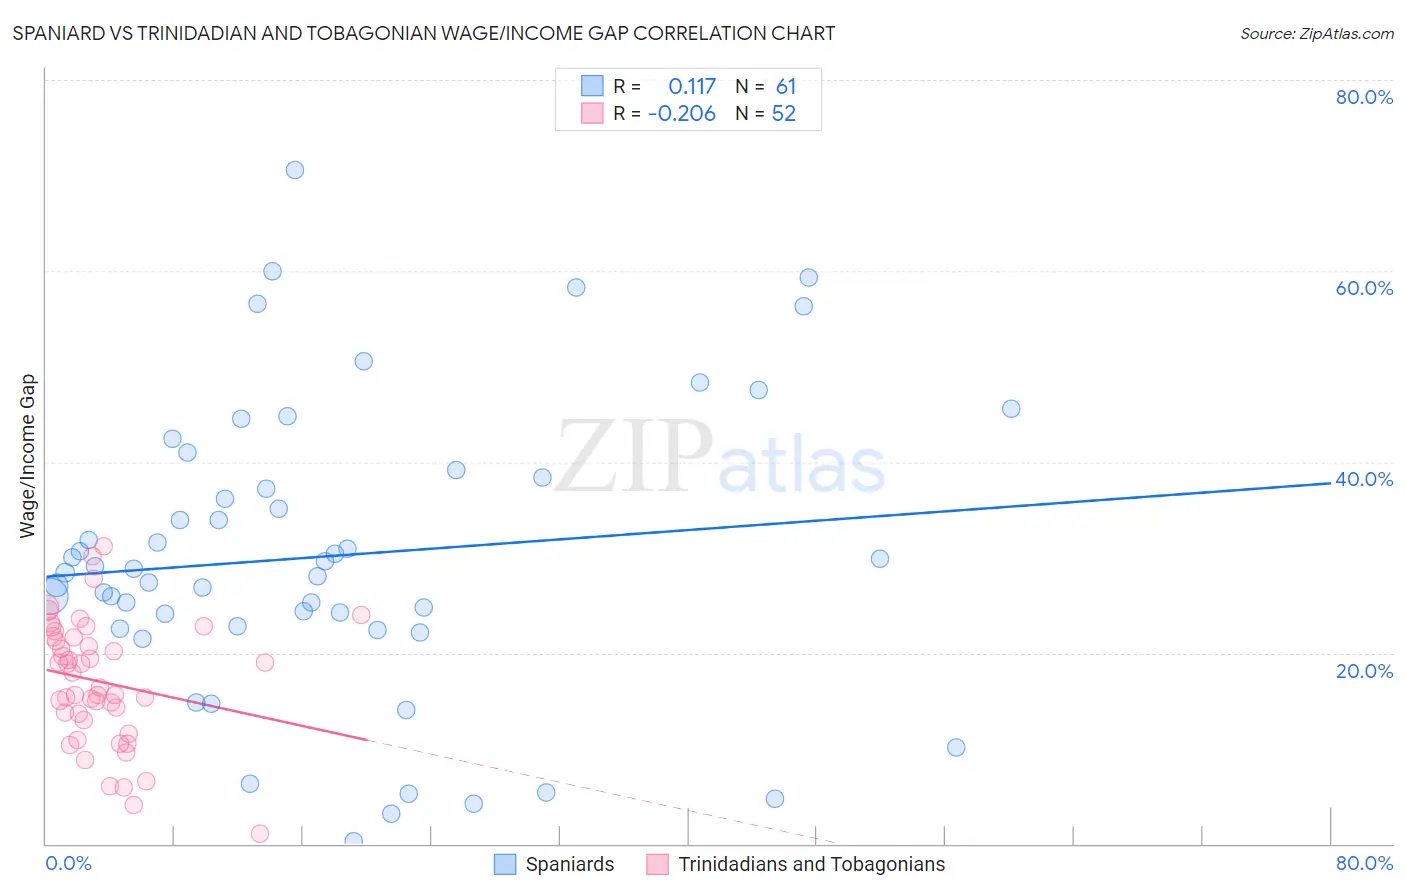
Spaniard vs Trinidadian and Tobagonian Wage/Income Gap Correlation Chart
The statistical analysis conducted on geographies consisting of 443,034,842 people shows a poor positive correlation between the proportion of Spaniards and wage/income gap percentage in the United States with a correlation coefficient (R) of 0.117 and weighted average of 27.0%. Similarly, the statistical analysis conducted on geographies consisting of 219,803,176 people shows a weak negative correlation between the proportion of Trinidadians and Tobagonians and wage/income gap percentage in the United States with a correlation coefficient (R) of -0.206 and weighted average of 19.3%, a difference of 39.5%.
Wage/Income Gap Correlation Summary
| Measurement | Spaniard | Trinidadian and Tobagonian |
| Minimum | 0.29% | 1.0% |
| Maximum | 70.6% | 31.1% |
| Range | 70.3% | 30.1% |
| Mean | 30.2% | 16.9% |
| Median | 28.7% | 17.1% |
| Interquartile 25% (IQ1) | 22.7% | 13.3% |
| Interquartile 75% (IQ3) | 38.8% | 21.6% |
| Interquartile Range (IQR) | 16.1% | 8.3% |
| Standard Deviation (Sample) | 15.4% | 6.5% |
| Standard Deviation (Population) | 15.3% | 6.4% |
Similar Demographics by Wage/Income Gap
Demographics Similar to Spaniards by Wage/Income Gap
In terms of wage/income gap, the demographic groups most similar to Spaniards are Immigrants from Turkey (27.0%, a difference of 0.0%), Immigrants from Asia (27.0%, a difference of 0.040%), Asian (26.9%, a difference of 0.080%), Ottawa (27.0%, a difference of 0.090%), and Bhutanese (27.0%, a difference of 0.11%).
| Demographics | Rating | Rank | Wage/Income Gap |
| Immigrants | Latvia | 8.9 /100 | #220 | Tragic 26.7% |
| Immigrants | Spain | 8.5 /100 | #221 | Tragic 26.8% |
| Bolivians | 8.3 /100 | #222 | Tragic 26.8% |
| Jordanians | 8.0 /100 | #223 | Tragic 26.8% |
| Immigrants | Argentina | 7.2 /100 | #224 | Tragic 26.8% |
| Immigrants | Ireland | 6.5 /100 | #225 | Tragic 26.9% |
| Asians | 5.9 /100 | #226 | Tragic 26.9% |
| Spaniards | 5.6 /100 | #227 | Tragic 27.0% |
| Immigrants | Turkey | 5.6 /100 | #228 | Tragic 27.0% |
| Immigrants | Asia | 5.5 /100 | #229 | Tragic 27.0% |
| Ottawa | 5.3 /100 | #230 | Tragic 27.0% |
| Bhutanese | 5.3 /100 | #231 | Tragic 27.0% |
| Argentineans | 5.2 /100 | #232 | Tragic 27.0% |
| Immigrants | Brazil | 5.0 /100 | #233 | Tragic 27.0% |
| Immigrants | Pakistan | 4.9 /100 | #234 | Tragic 27.0% |
Demographics Similar to Trinidadians and Tobagonians by Wage/Income Gap
In terms of wage/income gap, the demographic groups most similar to Trinidadians and Tobagonians are Immigrants from Trinidad and Tobago (19.3%, a difference of 0.050%), Immigrants from West Indies (19.2%, a difference of 0.48%), Immigrants from Haiti (19.2%, a difference of 0.59%), West Indian (19.6%, a difference of 1.2%), and Jamaican (19.6%, a difference of 1.4%).
| Demographics | Rating | Rank | Wage/Income Gap |
| Immigrants | Guyana | 100.0 /100 | #6 | Exceptional 18.4% |
| Puerto Ricans | 100.0 /100 | #7 | Exceptional 18.7% |
| Immigrants | Jamaica | 100.0 /100 | #8 | Exceptional 18.8% |
| Barbadians | 100.0 /100 | #9 | Exceptional 19.0% |
| Crow | 100.0 /100 | #10 | Exceptional 19.1% |
| Immigrants | Haiti | 100.0 /100 | #11 | Exceptional 19.2% |
| Immigrants | West Indies | 100.0 /100 | #12 | Exceptional 19.2% |
| Trinidadians and Tobagonians | 100.0 /100 | #13 | Exceptional 19.3% |
| Immigrants | Trinidad and Tobago | 100.0 /100 | #14 | Exceptional 19.3% |
| West Indians | 100.0 /100 | #15 | Exceptional 19.6% |
| Jamaicans | 100.0 /100 | #16 | Exceptional 19.6% |
| Haitians | 100.0 /100 | #17 | Exceptional 19.7% |
| Hopi | 100.0 /100 | #18 | Exceptional 20.0% |
| Immigrants | Dominica | 100.0 /100 | #19 | Exceptional 20.0% |
| Bahamians | 100.0 /100 | #20 | Exceptional 20.2% |