Somali vs Soviet Union Median Male Earnings
COMPARE
Somali
Soviet Union
Median Male Earnings
Median Male Earnings Comparison
Somalis
Soviet Union
$49,025
MEDIAN MALE EARNINGS
0.5/ 100
METRIC RATING
266th/ 347
METRIC RANK
$63,382
MEDIAN MALE EARNINGS
100.0/ 100
METRIC RATING
32nd/ 347
METRIC RANK
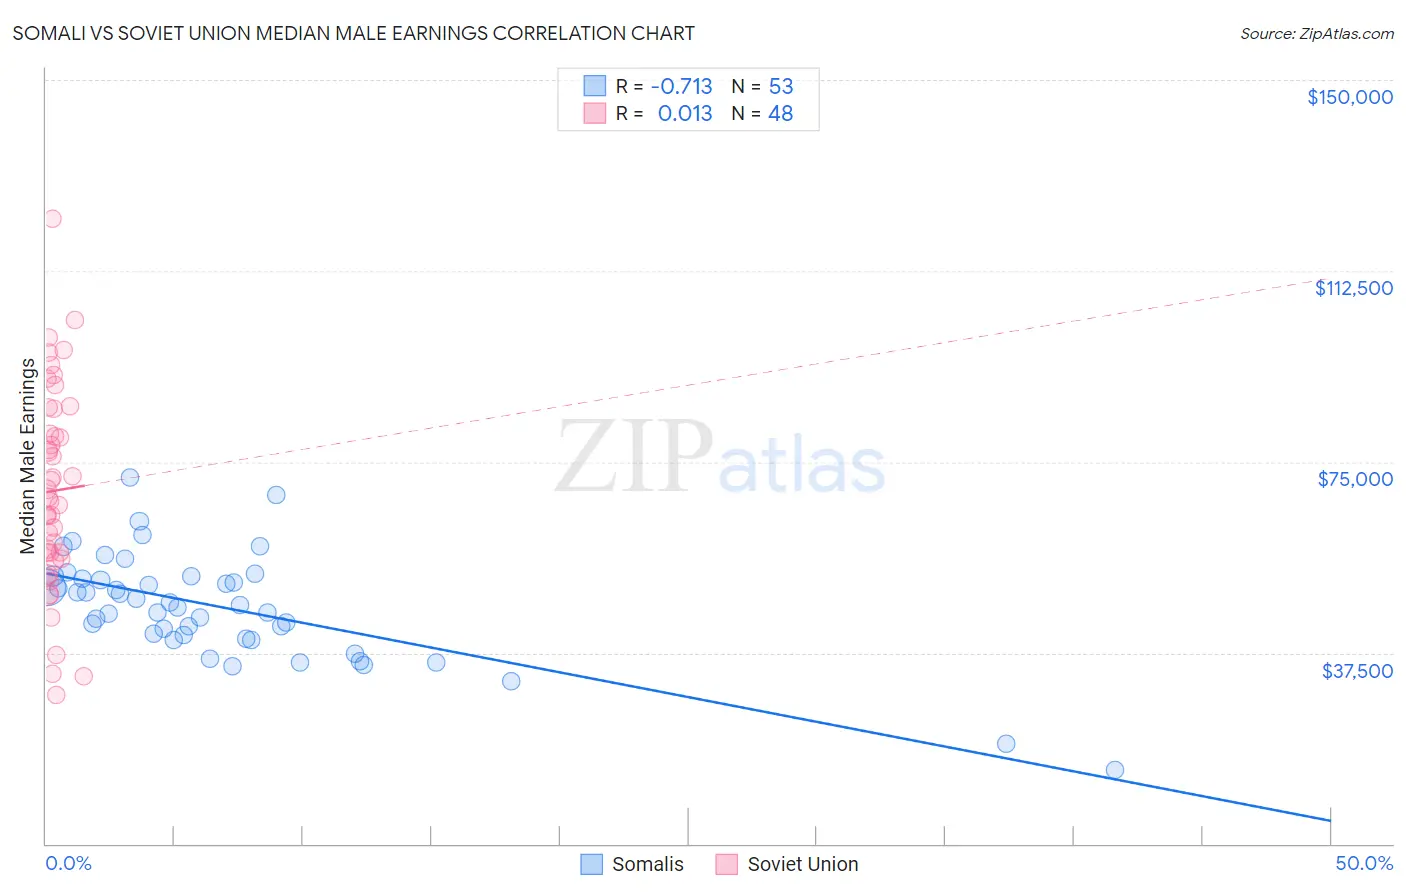
Somali vs Soviet Union Median Male Earnings Correlation Chart
The statistical analysis conducted on geographies consisting of 99,323,068 people shows a strong negative correlation between the proportion of Somalis and median male earnings in the United States with a correlation coefficient (R) of -0.713 and weighted average of $49,025. Similarly, the statistical analysis conducted on geographies consisting of 43,507,869 people shows no correlation between the proportion of Soviet Union and median male earnings in the United States with a correlation coefficient (R) of 0.013 and weighted average of $63,382, a difference of 29.3%.
Median Male Earnings Correlation Summary
| Measurement | Somali | Soviet Union |
| Minimum | $14,382 | $29,197 |
| Maximum | $71,947 | $122,813 |
| Range | $57,565 | $93,616 |
| Mean | $46,539 | $69,321 |
| Median | $46,803 | $67,564 |
| Interquartile 25% (IQ1) | $40,598 | $56,498 |
| Interquartile 75% (IQ3) | $52,221 | $82,953 |
| Interquartile Range (IQR) | $11,623 | $26,455 |
| Standard Deviation (Sample) | $10,412 | $19,957 |
| Standard Deviation (Population) | $10,313 | $19,748 |
Similar Demographics by Median Male Earnings
Demographics Similar to Somalis by Median Male Earnings
In terms of median male earnings, the demographic groups most similar to Somalis are Spanish American ($49,008, a difference of 0.040%), Ute ($48,899, a difference of 0.26%), Immigrants from Laos ($49,190, a difference of 0.34%), Immigrants from Middle Africa ($49,201, a difference of 0.36%), and Nicaraguan ($49,215, a difference of 0.39%).
| Demographics | Rating | Rank | Median Male Earnings |
| Nepalese | 0.7 /100 | #259 | Tragic $49,458 |
| Iroquois | 0.7 /100 | #260 | Tragic $49,374 |
| Liberians | 0.6 /100 | #261 | Tragic $49,318 |
| Immigrants | West Indies | 0.6 /100 | #262 | Tragic $49,271 |
| Nicaraguans | 0.6 /100 | #263 | Tragic $49,215 |
| Immigrants | Middle Africa | 0.6 /100 | #264 | Tragic $49,201 |
| Immigrants | Laos | 0.6 /100 | #265 | Tragic $49,190 |
| Somalis | 0.5 /100 | #266 | Tragic $49,025 |
| Spanish Americans | 0.5 /100 | #267 | Tragic $49,008 |
| Ute | 0.4 /100 | #268 | Tragic $48,899 |
| Tsimshian | 0.4 /100 | #269 | Tragic $48,836 |
| Potawatomi | 0.4 /100 | #270 | Tragic $48,768 |
| Cherokee | 0.3 /100 | #271 | Tragic $48,669 |
| Salvadorans | 0.3 /100 | #272 | Tragic $48,646 |
| Jamaicans | 0.3 /100 | #273 | Tragic $48,632 |
Demographics Similar to Soviet Union by Median Male Earnings
In terms of median male earnings, the demographic groups most similar to Soviet Union are Immigrants from Lithuania ($63,346, a difference of 0.060%), Immigrants from Russia ($63,326, a difference of 0.090%), Latvian ($63,498, a difference of 0.18%), Immigrants from Asia ($63,240, a difference of 0.22%), and Israeli ($63,228, a difference of 0.24%).
| Demographics | Rating | Rank | Median Male Earnings |
| Immigrants | Denmark | 100.0 /100 | #25 | Exceptional $64,625 |
| Turks | 100.0 /100 | #26 | Exceptional $64,253 |
| Immigrants | Switzerland | 100.0 /100 | #27 | Exceptional $63,944 |
| Russians | 100.0 /100 | #28 | Exceptional $63,939 |
| Asians | 100.0 /100 | #29 | Exceptional $63,827 |
| Immigrants | France | 100.0 /100 | #30 | Exceptional $63,715 |
| Latvians | 100.0 /100 | #31 | Exceptional $63,498 |
| Soviet Union | 100.0 /100 | #32 | Exceptional $63,382 |
| Immigrants | Lithuania | 100.0 /100 | #33 | Exceptional $63,346 |
| Immigrants | Russia | 100.0 /100 | #34 | Exceptional $63,326 |
| Immigrants | Asia | 100.0 /100 | #35 | Exceptional $63,240 |
| Israelis | 100.0 /100 | #36 | Exceptional $63,228 |
| Immigrants | Sri Lanka | 100.0 /100 | #37 | Exceptional $63,099 |
| Maltese | 100.0 /100 | #38 | Exceptional $62,953 |
| Immigrants | South Africa | 100.0 /100 | #39 | Exceptional $62,899 |