Immigrants from West Indies vs Immigrants from Netherlands Median Male Earnings
COMPARE
Immigrants from West Indies
Immigrants from Netherlands
Median Male Earnings
Median Male Earnings Comparison
Immigrants from West Indies
Immigrants from Netherlands
$49,271
MEDIAN MALE EARNINGS
0.6/ 100
METRIC RATING
262nd/ 347
METRIC RANK
$61,096
MEDIAN MALE EARNINGS
99.8/ 100
METRIC RATING
59th/ 347
METRIC RANK
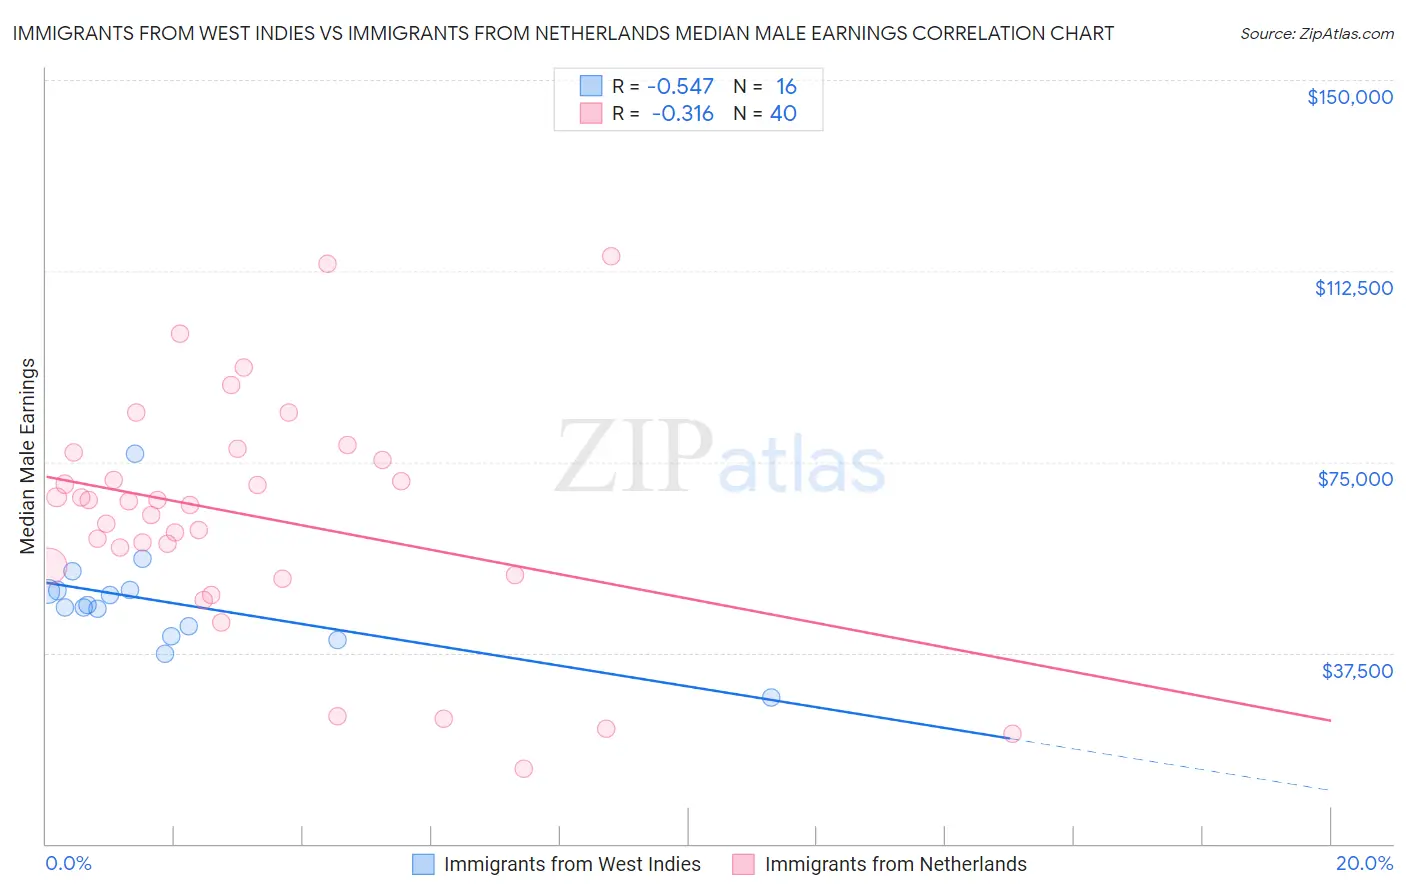
Immigrants from West Indies vs Immigrants from Netherlands Median Male Earnings Correlation Chart
The statistical analysis conducted on geographies consisting of 72,416,935 people shows a substantial negative correlation between the proportion of Immigrants from West Indies and median male earnings in the United States with a correlation coefficient (R) of -0.547 and weighted average of $49,271. Similarly, the statistical analysis conducted on geographies consisting of 237,827,633 people shows a mild negative correlation between the proportion of Immigrants from Netherlands and median male earnings in the United States with a correlation coefficient (R) of -0.316 and weighted average of $61,096, a difference of 24.0%.
Median Male Earnings Correlation Summary
| Measurement | Immigrants from West Indies | Immigrants from Netherlands |
| Minimum | $28,702 | $14,643 |
| Maximum | $76,711 | $115,494 |
| Range | $48,009 | $100,851 |
| Mean | $47,473 | $64,341 |
| Median | $46,662 | $66,907 |
| Interquartile 25% (IQ1) | $41,722 | $53,639 |
| Interquartile 75% (IQ3) | $49,852 | $76,092 |
| Interquartile Range (IQR) | $8,130 | $22,453 |
| Standard Deviation (Sample) | $10,214 | $22,767 |
| Standard Deviation (Population) | $9,890 | $22,481 |
Similar Demographics by Median Male Earnings
Demographics Similar to Immigrants from West Indies by Median Male Earnings
In terms of median male earnings, the demographic groups most similar to Immigrants from West Indies are Liberian ($49,318, a difference of 0.10%), Nicaraguan ($49,215, a difference of 0.11%), Immigrants from Middle Africa ($49,201, a difference of 0.14%), Immigrants from Laos ($49,190, a difference of 0.16%), and Iroquois ($49,374, a difference of 0.21%).
| Demographics | Rating | Rank | Median Male Earnings |
| Alaskan Athabascans | 0.9 /100 | #255 | Tragic $49,748 |
| Alaska Natives | 0.9 /100 | #256 | Tragic $49,711 |
| British West Indians | 0.8 /100 | #257 | Tragic $49,636 |
| Cree | 0.7 /100 | #258 | Tragic $49,497 |
| Nepalese | 0.7 /100 | #259 | Tragic $49,458 |
| Iroquois | 0.7 /100 | #260 | Tragic $49,374 |
| Liberians | 0.6 /100 | #261 | Tragic $49,318 |
| Immigrants | West Indies | 0.6 /100 | #262 | Tragic $49,271 |
| Nicaraguans | 0.6 /100 | #263 | Tragic $49,215 |
| Immigrants | Middle Africa | 0.6 /100 | #264 | Tragic $49,201 |
| Immigrants | Laos | 0.6 /100 | #265 | Tragic $49,190 |
| Somalis | 0.5 /100 | #266 | Tragic $49,025 |
| Spanish Americans | 0.5 /100 | #267 | Tragic $49,008 |
| Ute | 0.4 /100 | #268 | Tragic $48,899 |
| Tsimshian | 0.4 /100 | #269 | Tragic $48,836 |
Demographics Similar to Immigrants from Netherlands by Median Male Earnings
In terms of median male earnings, the demographic groups most similar to Immigrants from Netherlands are Egyptian ($61,095, a difference of 0.0%), Bolivian ($61,066, a difference of 0.050%), Immigrants from Romania ($61,040, a difference of 0.090%), New Zealander ($61,199, a difference of 0.17%), and Immigrants from Pakistan ($60,987, a difference of 0.18%).
| Demographics | Rating | Rank | Median Male Earnings |
| Immigrants | Norway | 99.9 /100 | #52 | Exceptional $61,628 |
| South Africans | 99.9 /100 | #53 | Exceptional $61,460 |
| Immigrants | Latvia | 99.9 /100 | #54 | Exceptional $61,422 |
| Greeks | 99.9 /100 | #55 | Exceptional $61,242 |
| Lithuanians | 99.9 /100 | #56 | Exceptional $61,228 |
| Immigrants | Scotland | 99.9 /100 | #57 | Exceptional $61,220 |
| New Zealanders | 99.9 /100 | #58 | Exceptional $61,199 |
| Immigrants | Netherlands | 99.8 /100 | #59 | Exceptional $61,096 |
| Egyptians | 99.8 /100 | #60 | Exceptional $61,095 |
| Bolivians | 99.8 /100 | #61 | Exceptional $61,066 |
| Immigrants | Romania | 99.8 /100 | #62 | Exceptional $61,040 |
| Immigrants | Pakistan | 99.8 /100 | #63 | Exceptional $60,987 |
| Immigrants | Eastern Europe | 99.8 /100 | #64 | Exceptional $60,958 |
| Immigrants | Indonesia | 99.8 /100 | #65 | Exceptional $60,935 |
| Immigrants | Croatia | 99.8 /100 | #66 | Exceptional $60,914 |