Pakistani vs Immigrants from Netherlands Median Male Earnings
COMPARE
Pakistani
Immigrants from Netherlands
Median Male Earnings
Median Male Earnings Comparison
Pakistanis
Immigrants from Netherlands
$56,719
MEDIAN MALE EARNINGS
89.9/ 100
METRIC RATING
129th/ 347
METRIC RANK
$61,096
MEDIAN MALE EARNINGS
99.8/ 100
METRIC RATING
59th/ 347
METRIC RANK
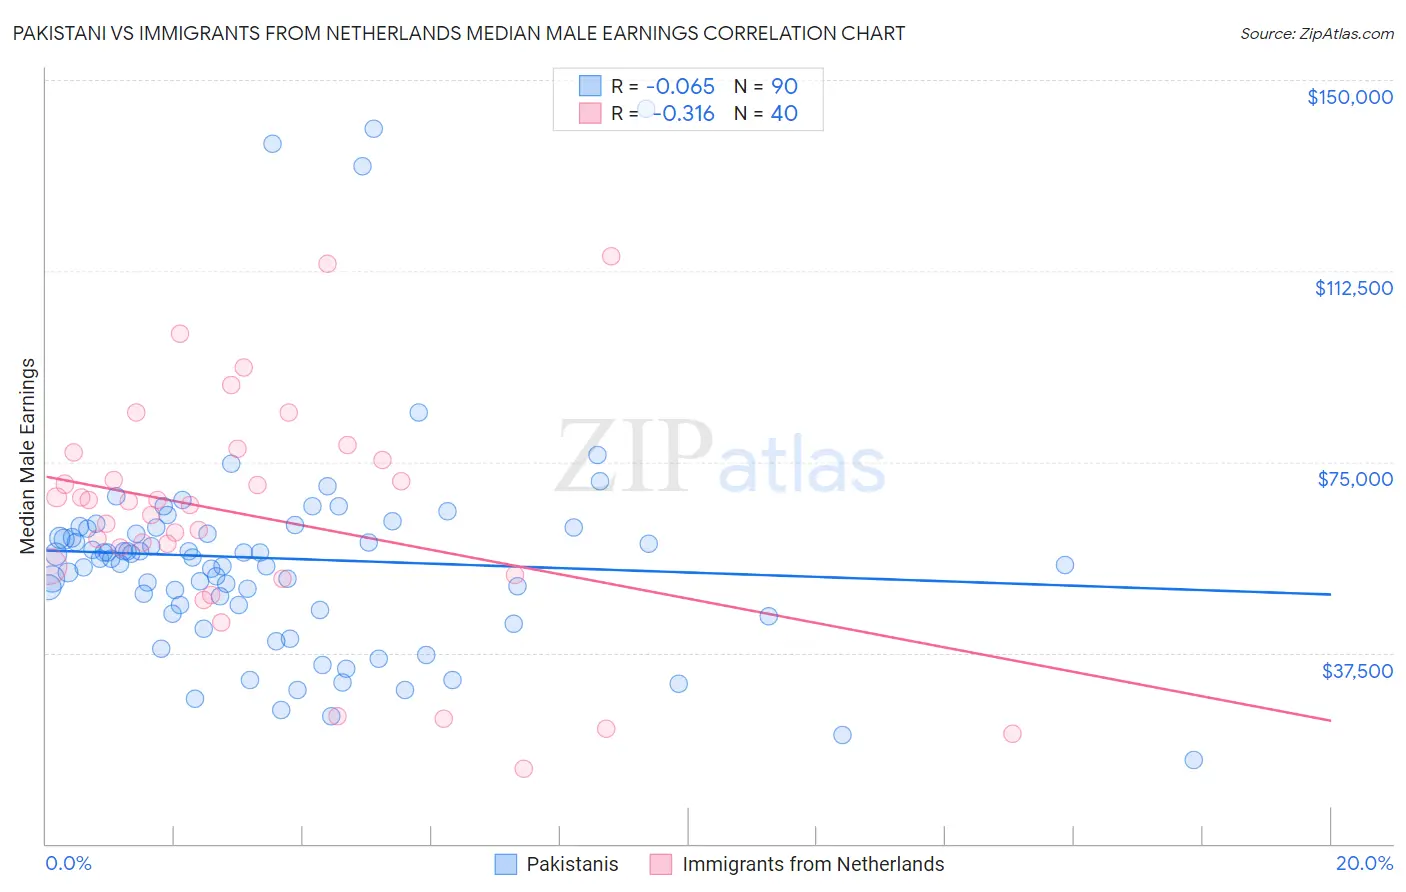
Pakistani vs Immigrants from Netherlands Median Male Earnings Correlation Chart
The statistical analysis conducted on geographies consisting of 335,324,155 people shows a slight negative correlation between the proportion of Pakistanis and median male earnings in the United States with a correlation coefficient (R) of -0.065 and weighted average of $56,719. Similarly, the statistical analysis conducted on geographies consisting of 237,827,633 people shows a mild negative correlation between the proportion of Immigrants from Netherlands and median male earnings in the United States with a correlation coefficient (R) of -0.316 and weighted average of $61,096, a difference of 7.7%.
Median Male Earnings Correlation Summary
| Measurement | Pakistani | Immigrants from Netherlands |
| Minimum | $16,406 | $14,643 |
| Maximum | $144,236 | $115,494 |
| Range | $127,830 | $100,851 |
| Mean | $56,003 | $64,341 |
| Median | $55,878 | $66,907 |
| Interquartile 25% (IQ1) | $45,960 | $53,639 |
| Interquartile 75% (IQ3) | $61,933 | $76,092 |
| Interquartile Range (IQR) | $15,973 | $22,453 |
| Standard Deviation (Sample) | $22,100 | $22,767 |
| Standard Deviation (Population) | $21,977 | $22,481 |
Similar Demographics by Median Male Earnings
Demographics Similar to Pakistanis by Median Male Earnings
In terms of median male earnings, the demographic groups most similar to Pakistanis are Korean ($56,672, a difference of 0.080%), Portuguese ($56,663, a difference of 0.10%), Immigrants from Syria ($56,830, a difference of 0.20%), Brazilian ($56,837, a difference of 0.21%), and Chinese ($56,872, a difference of 0.27%).
| Demographics | Rating | Rank | Median Male Earnings |
| Immigrants | Jordan | 93.1 /100 | #122 | Exceptional $57,145 |
| Slovenes | 93.1 /100 | #123 | Exceptional $57,145 |
| Chileans | 91.9 /100 | #124 | Exceptional $56,973 |
| Immigrants | Morocco | 91.8 /100 | #125 | Exceptional $56,958 |
| Chinese | 91.1 /100 | #126 | Exceptional $56,872 |
| Brazilians | 90.9 /100 | #127 | Exceptional $56,837 |
| Immigrants | Syria | 90.8 /100 | #128 | Exceptional $56,830 |
| Pakistanis | 89.9 /100 | #129 | Excellent $56,719 |
| Koreans | 89.4 /100 | #130 | Excellent $56,672 |
| Portuguese | 89.4 /100 | #131 | Excellent $56,663 |
| Czechs | 88.2 /100 | #132 | Excellent $56,546 |
| Immigrants | Germany | 88.2 /100 | #133 | Excellent $56,542 |
| Moroccans | 87.7 /100 | #134 | Excellent $56,499 |
| Irish | 87.4 /100 | #135 | Excellent $56,464 |
| Immigrants | Saudi Arabia | 87.2 /100 | #136 | Excellent $56,452 |
Demographics Similar to Immigrants from Netherlands by Median Male Earnings
In terms of median male earnings, the demographic groups most similar to Immigrants from Netherlands are Egyptian ($61,095, a difference of 0.0%), Bolivian ($61,066, a difference of 0.050%), Immigrants from Romania ($61,040, a difference of 0.090%), New Zealander ($61,199, a difference of 0.17%), and Immigrants from Pakistan ($60,987, a difference of 0.18%).
| Demographics | Rating | Rank | Median Male Earnings |
| Immigrants | Norway | 99.9 /100 | #52 | Exceptional $61,628 |
| South Africans | 99.9 /100 | #53 | Exceptional $61,460 |
| Immigrants | Latvia | 99.9 /100 | #54 | Exceptional $61,422 |
| Greeks | 99.9 /100 | #55 | Exceptional $61,242 |
| Lithuanians | 99.9 /100 | #56 | Exceptional $61,228 |
| Immigrants | Scotland | 99.9 /100 | #57 | Exceptional $61,220 |
| New Zealanders | 99.9 /100 | #58 | Exceptional $61,199 |
| Immigrants | Netherlands | 99.8 /100 | #59 | Exceptional $61,096 |
| Egyptians | 99.8 /100 | #60 | Exceptional $61,095 |
| Bolivians | 99.8 /100 | #61 | Exceptional $61,066 |
| Immigrants | Romania | 99.8 /100 | #62 | Exceptional $61,040 |
| Immigrants | Pakistan | 99.8 /100 | #63 | Exceptional $60,987 |
| Immigrants | Eastern Europe | 99.8 /100 | #64 | Exceptional $60,958 |
| Immigrants | Indonesia | 99.8 /100 | #65 | Exceptional $60,935 |
| Immigrants | Croatia | 99.8 /100 | #66 | Exceptional $60,914 |