Immigrants from Ukraine vs Immigrants from Netherlands Median Male Earnings
COMPARE
Immigrants from Ukraine
Immigrants from Netherlands
Median Male Earnings
Median Male Earnings Comparison
Immigrants from Ukraine
Immigrants from Netherlands
$59,820
MEDIAN MALE EARNINGS
99.5/ 100
METRIC RATING
79th/ 347
METRIC RANK
$61,096
MEDIAN MALE EARNINGS
99.8/ 100
METRIC RATING
59th/ 347
METRIC RANK
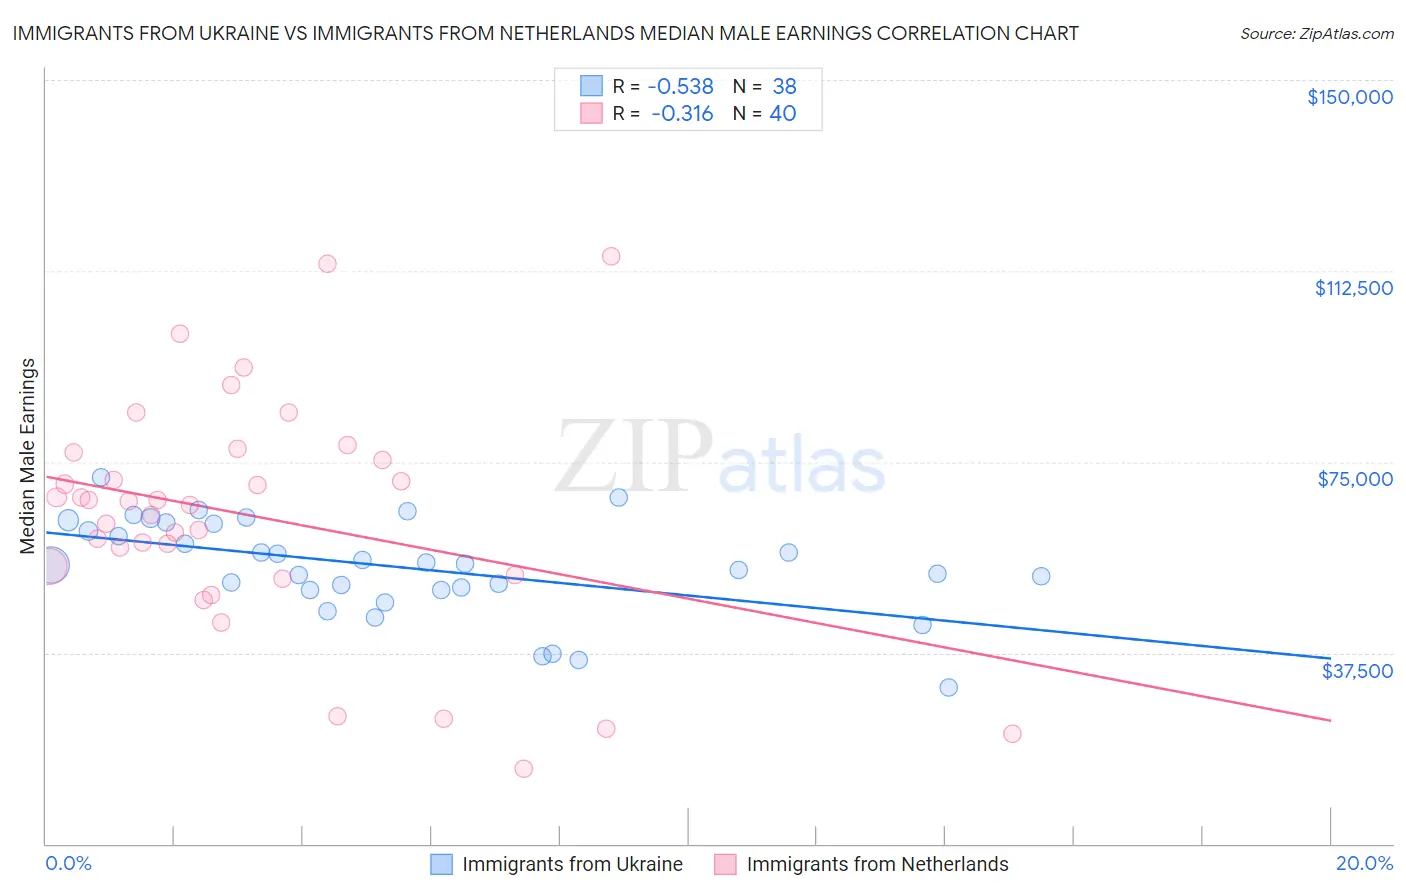
Immigrants from Ukraine vs Immigrants from Netherlands Median Male Earnings Correlation Chart
The statistical analysis conducted on geographies consisting of 289,634,728 people shows a substantial negative correlation between the proportion of Immigrants from Ukraine and median male earnings in the United States with a correlation coefficient (R) of -0.538 and weighted average of $59,820. Similarly, the statistical analysis conducted on geographies consisting of 237,827,633 people shows a mild negative correlation between the proportion of Immigrants from Netherlands and median male earnings in the United States with a correlation coefficient (R) of -0.316 and weighted average of $61,096, a difference of 2.1%.
Median Male Earnings Correlation Summary
| Measurement | Immigrants from Ukraine | Immigrants from Netherlands |
| Minimum | $30,721 | $14,643 |
| Maximum | $71,961 | $115,494 |
| Range | $41,240 | $100,851 |
| Mean | $54,290 | $64,341 |
| Median | $54,853 | $66,907 |
| Interquartile 25% (IQ1) | $49,956 | $53,639 |
| Interquartile 75% (IQ3) | $62,824 | $76,092 |
| Interquartile Range (IQR) | $12,868 | $22,453 |
| Standard Deviation (Sample) | $9,509 | $22,767 |
| Standard Deviation (Population) | $9,383 | $22,481 |
Demographics Similar to Immigrants from Ukraine and Immigrants from Netherlands by Median Male Earnings
In terms of median male earnings, the demographic groups most similar to Immigrants from Ukraine are Immigrants from Egypt ($59,925, a difference of 0.18%), Paraguayan ($59,975, a difference of 0.26%), Romanian ($60,063, a difference of 0.41%), Immigrants from Bolivia ($60,088, a difference of 0.45%), and Argentinean ($60,117, a difference of 0.50%). Similarly, the demographic groups most similar to Immigrants from Netherlands are Egyptian ($61,095, a difference of 0.0%), Bolivian ($61,066, a difference of 0.050%), Immigrants from Romania ($61,040, a difference of 0.090%), Immigrants from Pakistan ($60,987, a difference of 0.18%), and Immigrants from Eastern Europe ($60,958, a difference of 0.23%).
| Demographics | Rating | Rank | Median Male Earnings |
| Immigrants | Netherlands | 99.8 /100 | #59 | Exceptional $61,096 |
| Egyptians | 99.8 /100 | #60 | Exceptional $61,095 |
| Bolivians | 99.8 /100 | #61 | Exceptional $61,066 |
| Immigrants | Romania | 99.8 /100 | #62 | Exceptional $61,040 |
| Immigrants | Pakistan | 99.8 /100 | #63 | Exceptional $60,987 |
| Immigrants | Eastern Europe | 99.8 /100 | #64 | Exceptional $60,958 |
| Immigrants | Indonesia | 99.8 /100 | #65 | Exceptional $60,935 |
| Immigrants | Croatia | 99.8 /100 | #66 | Exceptional $60,914 |
| Immigrants | Spain | 99.8 /100 | #67 | Exceptional $60,750 |
| Immigrants | Serbia | 99.7 /100 | #68 | Exceptional $60,600 |
| Immigrants | Canada | 99.7 /100 | #69 | Exceptional $60,388 |
| Immigrants | Bulgaria | 99.7 /100 | #70 | Exceptional $60,358 |
| Mongolians | 99.7 /100 | #71 | Exceptional $60,350 |
| Immigrants | Western Europe | 99.7 /100 | #72 | Exceptional $60,334 |
| Immigrants | North America | 99.7 /100 | #73 | Exceptional $60,265 |
| Argentineans | 99.6 /100 | #74 | Exceptional $60,117 |
| Immigrants | Bolivia | 99.6 /100 | #75 | Exceptional $60,088 |
| Romanians | 99.6 /100 | #76 | Exceptional $60,063 |
| Paraguayans | 99.5 /100 | #77 | Exceptional $59,975 |
| Immigrants | Egypt | 99.5 /100 | #78 | Exceptional $59,925 |
| Immigrants | Ukraine | 99.5 /100 | #79 | Exceptional $59,820 |