Somali vs Samoan Median Male Earnings
COMPARE
Somali
Samoan
Median Male Earnings
Median Male Earnings Comparison
Somalis
Samoans
$49,025
MEDIAN MALE EARNINGS
0.5/ 100
METRIC RATING
266th/ 347
METRIC RANK
$51,389
MEDIAN MALE EARNINGS
4.6/ 100
METRIC RATING
228th/ 347
METRIC RANK
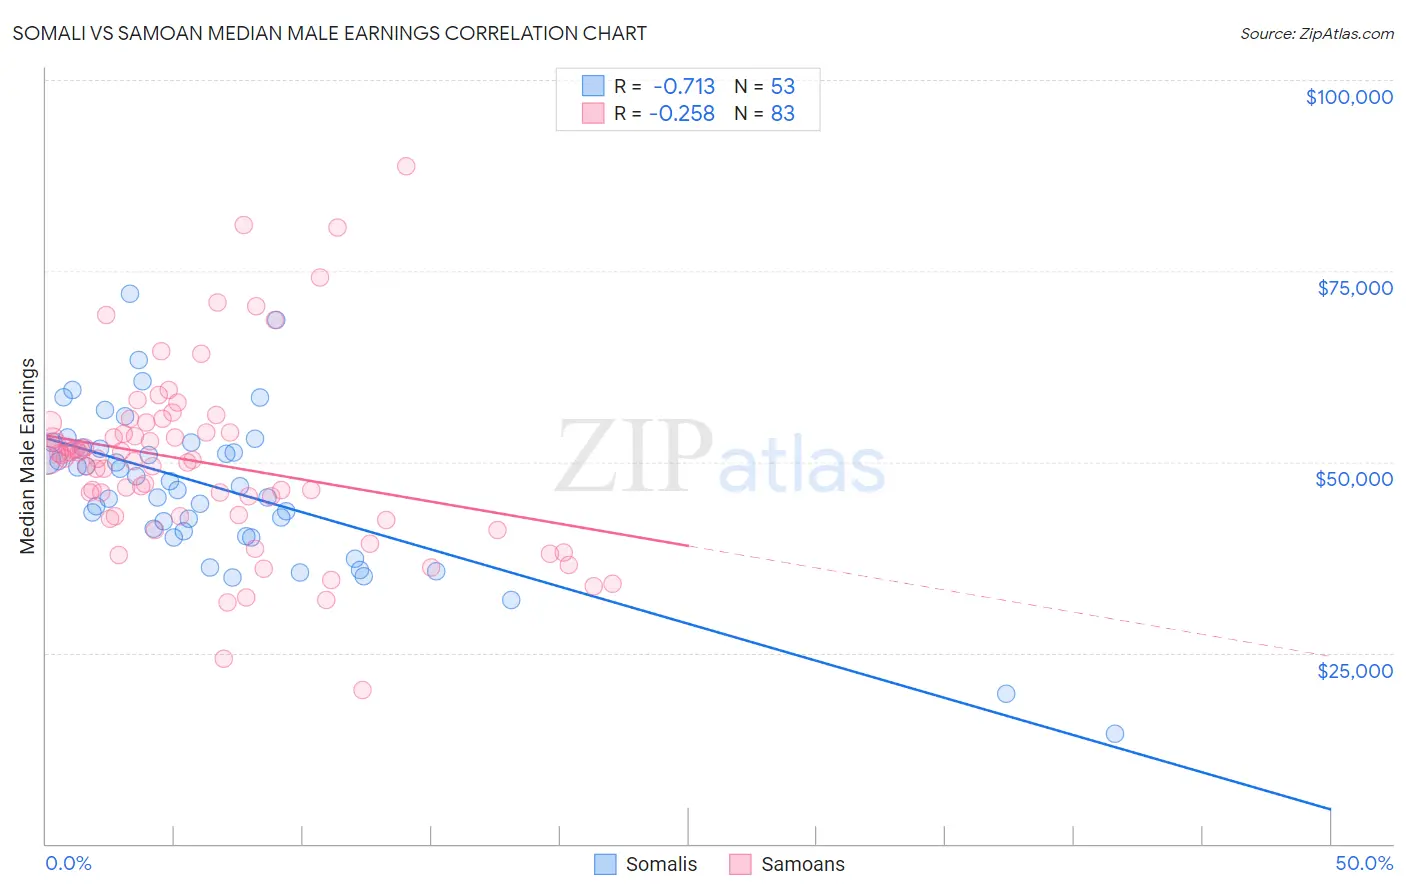
Somali vs Samoan Median Male Earnings Correlation Chart
The statistical analysis conducted on geographies consisting of 99,323,068 people shows a strong negative correlation between the proportion of Somalis and median male earnings in the United States with a correlation coefficient (R) of -0.713 and weighted average of $49,025. Similarly, the statistical analysis conducted on geographies consisting of 225,157,304 people shows a weak negative correlation between the proportion of Samoans and median male earnings in the United States with a correlation coefficient (R) of -0.258 and weighted average of $51,389, a difference of 4.8%.
Median Male Earnings Correlation Summary
| Measurement | Somali | Samoan |
| Minimum | $14,382 | $20,179 |
| Maximum | $71,947 | $88,750 |
| Range | $57,565 | $68,571 |
| Mean | $46,539 | $49,891 |
| Median | $46,803 | $50,415 |
| Interquartile 25% (IQ1) | $40,598 | $42,816 |
| Interquartile 75% (IQ3) | $52,221 | $53,887 |
| Interquartile Range (IQR) | $11,623 | $11,071 |
| Standard Deviation (Sample) | $10,412 | $11,942 |
| Standard Deviation (Population) | $10,313 | $11,870 |
Similar Demographics by Median Male Earnings
Demographics Similar to Somalis by Median Male Earnings
In terms of median male earnings, the demographic groups most similar to Somalis are Spanish American ($49,008, a difference of 0.040%), Ute ($48,899, a difference of 0.26%), Immigrants from Laos ($49,190, a difference of 0.34%), Immigrants from Middle Africa ($49,201, a difference of 0.36%), and Nicaraguan ($49,215, a difference of 0.39%).
| Demographics | Rating | Rank | Median Male Earnings |
| Nepalese | 0.7 /100 | #259 | Tragic $49,458 |
| Iroquois | 0.7 /100 | #260 | Tragic $49,374 |
| Liberians | 0.6 /100 | #261 | Tragic $49,318 |
| Immigrants | West Indies | 0.6 /100 | #262 | Tragic $49,271 |
| Nicaraguans | 0.6 /100 | #263 | Tragic $49,215 |
| Immigrants | Middle Africa | 0.6 /100 | #264 | Tragic $49,201 |
| Immigrants | Laos | 0.6 /100 | #265 | Tragic $49,190 |
| Somalis | 0.5 /100 | #266 | Tragic $49,025 |
| Spanish Americans | 0.5 /100 | #267 | Tragic $49,008 |
| Ute | 0.4 /100 | #268 | Tragic $48,899 |
| Tsimshian | 0.4 /100 | #269 | Tragic $48,836 |
| Potawatomi | 0.4 /100 | #270 | Tragic $48,768 |
| Cherokee | 0.3 /100 | #271 | Tragic $48,669 |
| Salvadorans | 0.3 /100 | #272 | Tragic $48,646 |
| Jamaicans | 0.3 /100 | #273 | Tragic $48,632 |
Demographics Similar to Samoans by Median Male Earnings
In terms of median male earnings, the demographic groups most similar to Samoans are Immigrants from Trinidad and Tobago ($51,376, a difference of 0.030%), Trinidadian and Tobagonian ($51,446, a difference of 0.11%), Japanese ($51,473, a difference of 0.16%), Immigrants from Nigeria ($51,310, a difference of 0.16%), and Immigrants from Sudan ($51,489, a difference of 0.19%).
| Demographics | Rating | Rank | Median Male Earnings |
| Immigrants | Senegal | 5.8 /100 | #221 | Tragic $51,647 |
| Immigrants | Bangladesh | 5.8 /100 | #222 | Tragic $51,642 |
| Ecuadorians | 5.5 /100 | #223 | Tragic $51,596 |
| Immigrants | Cambodia | 5.5 /100 | #224 | Tragic $51,594 |
| Immigrants | Sudan | 5.0 /100 | #225 | Tragic $51,489 |
| Japanese | 4.9 /100 | #226 | Tragic $51,473 |
| Trinidadians and Tobagonians | 4.8 /100 | #227 | Tragic $51,446 |
| Samoans | 4.6 /100 | #228 | Tragic $51,389 |
| Immigrants | Trinidad and Tobago | 4.5 /100 | #229 | Tragic $51,376 |
| Immigrants | Nigeria | 4.2 /100 | #230 | Tragic $51,310 |
| Barbadians | 3.9 /100 | #231 | Tragic $51,236 |
| Sudanese | 3.9 /100 | #232 | Tragic $51,216 |
| Aleuts | 3.7 /100 | #233 | Tragic $51,168 |
| Cape Verdeans | 3.5 /100 | #234 | Tragic $51,103 |
| Immigrants | Western Africa | 3.0 /100 | #235 | Tragic $50,940 |