Immigrants from Belarus vs Immigrants from Netherlands Median Male Earnings
COMPARE
Immigrants from Belarus
Immigrants from Netherlands
Median Male Earnings
Median Male Earnings Comparison
Immigrants from Belarus
Immigrants from Netherlands
$62,658
MEDIAN MALE EARNINGS
100.0/ 100
METRIC RATING
43rd/ 347
METRIC RANK
$61,096
MEDIAN MALE EARNINGS
99.8/ 100
METRIC RATING
59th/ 347
METRIC RANK
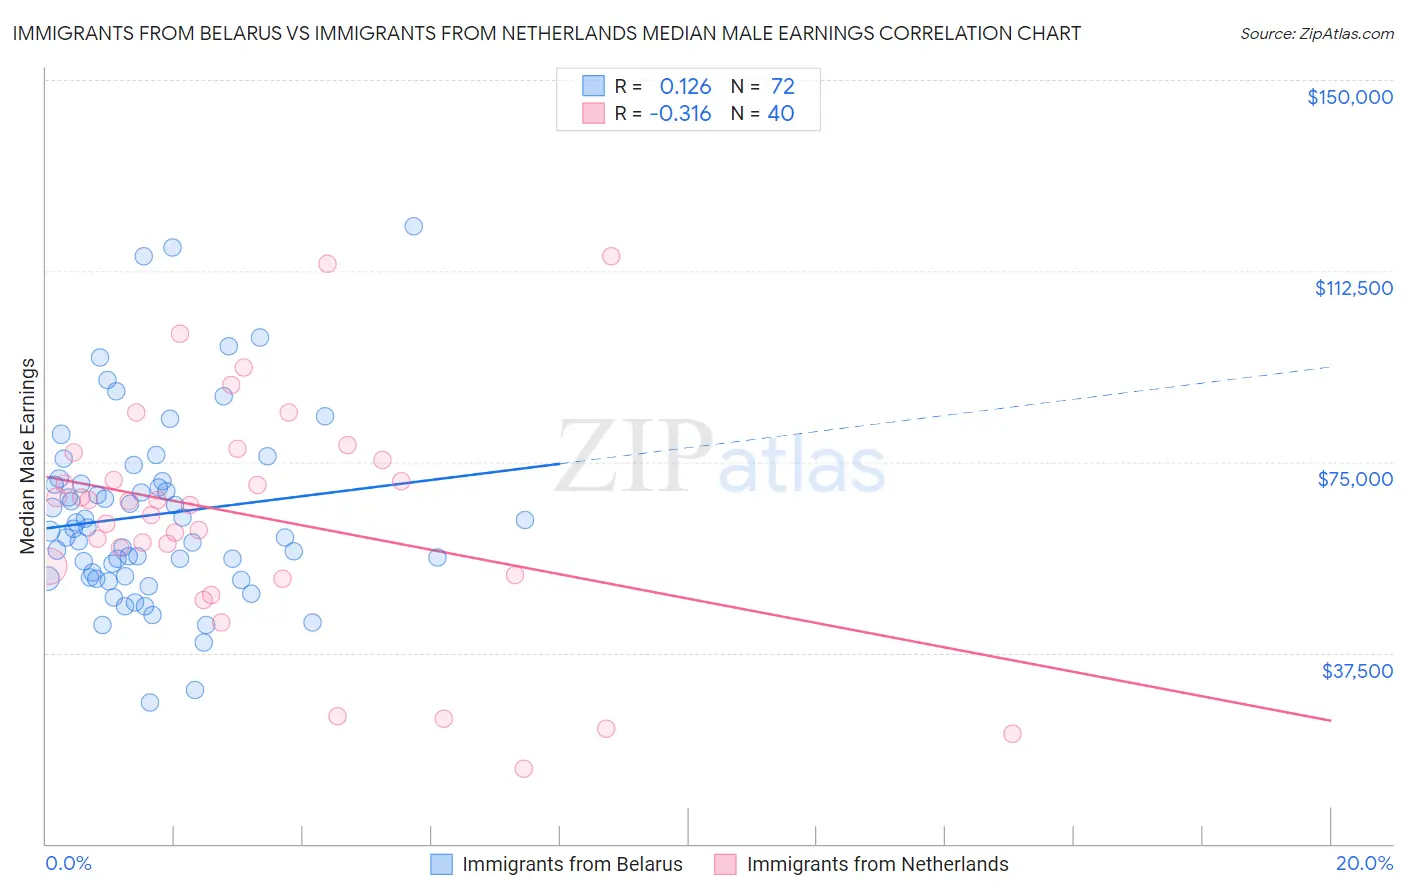
Immigrants from Belarus vs Immigrants from Netherlands Median Male Earnings Correlation Chart
The statistical analysis conducted on geographies consisting of 150,194,615 people shows a poor positive correlation between the proportion of Immigrants from Belarus and median male earnings in the United States with a correlation coefficient (R) of 0.126 and weighted average of $62,658. Similarly, the statistical analysis conducted on geographies consisting of 237,827,633 people shows a mild negative correlation between the proportion of Immigrants from Netherlands and median male earnings in the United States with a correlation coefficient (R) of -0.316 and weighted average of $61,096, a difference of 2.6%.
Median Male Earnings Correlation Summary
| Measurement | Immigrants from Belarus | Immigrants from Netherlands |
| Minimum | $27,820 | $14,643 |
| Maximum | $121,250 | $115,494 |
| Range | $93,430 | $100,851 |
| Mean | $64,628 | $64,341 |
| Median | $61,571 | $66,907 |
| Interquartile 25% (IQ1) | $52,308 | $53,639 |
| Interquartile 75% (IQ3) | $70,925 | $76,092 |
| Interquartile Range (IQR) | $18,618 | $22,453 |
| Standard Deviation (Sample) | $18,362 | $22,767 |
| Standard Deviation (Population) | $18,234 | $22,481 |
Demographics Similar to Immigrants from Belarus and Immigrants from Netherlands by Median Male Earnings
In terms of median male earnings, the demographic groups most similar to Immigrants from Belarus are Immigrants from Greece ($62,689, a difference of 0.050%), Immigrants from Turkey ($62,728, a difference of 0.11%), Cambodian ($62,516, a difference of 0.23%), Bulgarian ($62,378, a difference of 0.45%), and Immigrants from Czechoslovakia ($62,217, a difference of 0.71%). Similarly, the demographic groups most similar to Immigrants from Netherlands are Egyptian ($61,095, a difference of 0.0%), Bolivian ($61,066, a difference of 0.050%), New Zealander ($61,199, a difference of 0.17%), Immigrants from Scotland ($61,220, a difference of 0.20%), and Lithuanian ($61,228, a difference of 0.22%).
| Demographics | Rating | Rank | Median Male Earnings |
| Immigrants | Turkey | 100.0 /100 | #41 | Exceptional $62,728 |
| Immigrants | Greece | 100.0 /100 | #42 | Exceptional $62,689 |
| Immigrants | Belarus | 100.0 /100 | #43 | Exceptional $62,658 |
| Cambodians | 100.0 /100 | #44 | Exceptional $62,516 |
| Bulgarians | 100.0 /100 | #45 | Exceptional $62,378 |
| Immigrants | Czechoslovakia | 99.9 /100 | #46 | Exceptional $62,217 |
| Immigrants | Austria | 99.9 /100 | #47 | Exceptional $62,164 |
| Immigrants | Malaysia | 99.9 /100 | #48 | Exceptional $62,121 |
| Immigrants | Europe | 99.9 /100 | #49 | Exceptional $62,057 |
| Bhutanese | 99.9 /100 | #50 | Exceptional $61,759 |
| Estonians | 99.9 /100 | #51 | Exceptional $61,710 |
| Immigrants | Norway | 99.9 /100 | #52 | Exceptional $61,628 |
| South Africans | 99.9 /100 | #53 | Exceptional $61,460 |
| Immigrants | Latvia | 99.9 /100 | #54 | Exceptional $61,422 |
| Greeks | 99.9 /100 | #55 | Exceptional $61,242 |
| Lithuanians | 99.9 /100 | #56 | Exceptional $61,228 |
| Immigrants | Scotland | 99.9 /100 | #57 | Exceptional $61,220 |
| New Zealanders | 99.9 /100 | #58 | Exceptional $61,199 |
| Immigrants | Netherlands | 99.8 /100 | #59 | Exceptional $61,096 |
| Egyptians | 99.8 /100 | #60 | Exceptional $61,095 |
| Bolivians | 99.8 /100 | #61 | Exceptional $61,066 |