Paiute vs Ukrainian Median Female Earnings
COMPARE
Paiute
Ukrainian
Median Female Earnings
Median Female Earnings Comparison
Paiute
Ukrainians
$36,056
MEDIAN FEMALE EARNINGS
0.1/ 100
METRIC RATING
285th/ 347
METRIC RANK
$42,015
MEDIAN FEMALE EARNINGS
99.2/ 100
METRIC RATING
90th/ 347
METRIC RANK
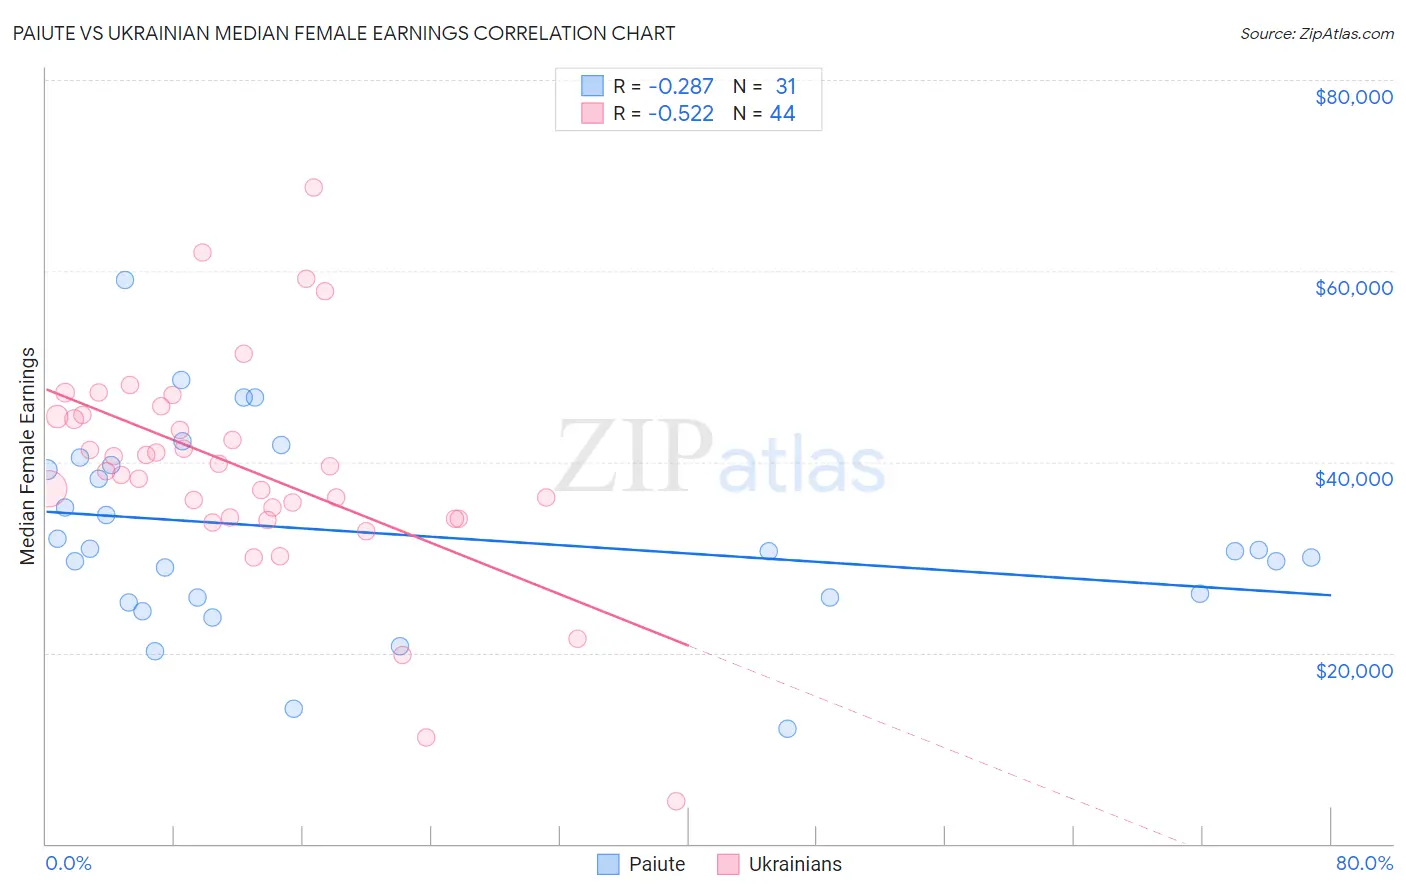
Paiute vs Ukrainian Median Female Earnings Correlation Chart
The statistical analysis conducted on geographies consisting of 58,379,978 people shows a weak negative correlation between the proportion of Paiute and median female earnings in the United States with a correlation coefficient (R) of -0.287 and weighted average of $36,056. Similarly, the statistical analysis conducted on geographies consisting of 448,339,242 people shows a substantial negative correlation between the proportion of Ukrainians and median female earnings in the United States with a correlation coefficient (R) of -0.522 and weighted average of $42,015, a difference of 16.5%.
Median Female Earnings Correlation Summary
| Measurement | Paiute | Ukrainian |
| Minimum | $12,045 | $4,400 |
| Maximum | $59,011 | $68,750 |
| Range | $46,966 | $64,350 |
| Mean | $32,370 | $39,267 |
| Median | $30,682 | $39,270 |
| Interquartile 25% (IQ1) | $25,816 | $34,102 |
| Interquartile 75% (IQ3) | $39,733 | $44,856 |
| Interquartile Range (IQR) | $13,917 | $10,753 |
| Standard Deviation (Sample) | $10,286 | $11,661 |
| Standard Deviation (Population) | $10,119 | $11,527 |
Similar Demographics by Median Female Earnings
Demographics Similar to Paiute by Median Female Earnings
In terms of median female earnings, the demographic groups most similar to Paiute are Osage ($36,034, a difference of 0.060%), Immigrants from Nicaragua ($36,023, a difference of 0.090%), Immigrants from Zaire ($36,017, a difference of 0.11%), Indonesian ($36,140, a difference of 0.23%), and Bangladeshi ($35,960, a difference of 0.27%).
| Demographics | Rating | Rank | Median Female Earnings |
| U.S. Virgin Islanders | 0.1 /100 | #278 | Tragic $36,424 |
| Immigrants | Caribbean | 0.1 /100 | #279 | Tragic $36,414 |
| Iroquois | 0.1 /100 | #280 | Tragic $36,408 |
| Spanish Americans | 0.1 /100 | #281 | Tragic $36,391 |
| Haitians | 0.1 /100 | #282 | Tragic $36,374 |
| Immigrants | Haiti | 0.1 /100 | #283 | Tragic $36,203 |
| Indonesians | 0.1 /100 | #284 | Tragic $36,140 |
| Paiute | 0.1 /100 | #285 | Tragic $36,056 |
| Osage | 0.0 /100 | #286 | Tragic $36,034 |
| Immigrants | Nicaragua | 0.0 /100 | #287 | Tragic $36,023 |
| Immigrants | Zaire | 0.0 /100 | #288 | Tragic $36,017 |
| Bangladeshis | 0.0 /100 | #289 | Tragic $35,960 |
| Central American Indians | 0.0 /100 | #290 | Tragic $35,930 |
| Blackfeet | 0.0 /100 | #291 | Tragic $35,864 |
| Americans | 0.0 /100 | #292 | Tragic $35,777 |
Demographics Similar to Ukrainians by Median Female Earnings
In terms of median female earnings, the demographic groups most similar to Ukrainians are Immigrants from Western Europe ($41,990, a difference of 0.060%), Immigrants from Afghanistan ($42,055, a difference of 0.10%), Argentinean ($41,952, a difference of 0.15%), Immigrants from Northern Africa ($42,084, a difference of 0.16%), and Immigrants from Grenada ($41,932, a difference of 0.20%).
| Demographics | Rating | Rank | Median Female Earnings |
| Immigrants | Sierra Leone | 99.5 /100 | #83 | Exceptional $42,214 |
| Armenians | 99.5 /100 | #84 | Exceptional $42,212 |
| Laotians | 99.4 /100 | #85 | Exceptional $42,133 |
| Immigrants | St. Vincent and the Grenadines | 99.3 /100 | #86 | Exceptional $42,108 |
| Lithuanians | 99.3 /100 | #87 | Exceptional $42,108 |
| Immigrants | Northern Africa | 99.3 /100 | #88 | Exceptional $42,084 |
| Immigrants | Afghanistan | 99.3 /100 | #89 | Exceptional $42,055 |
| Ukrainians | 99.2 /100 | #90 | Exceptional $42,015 |
| Immigrants | Western Europe | 99.2 /100 | #91 | Exceptional $41,990 |
| Argentineans | 99.1 /100 | #92 | Exceptional $41,952 |
| Immigrants | Grenada | 99.0 /100 | #93 | Exceptional $41,932 |
| Moroccans | 98.9 /100 | #94 | Exceptional $41,872 |
| Immigrants | Netherlands | 98.9 /100 | #95 | Exceptional $41,870 |
| South Africans | 98.8 /100 | #96 | Exceptional $41,825 |
| Immigrants | Hungary | 98.8 /100 | #97 | Exceptional $41,820 |