Potawatomi vs Ukrainian Median Female Earnings
COMPARE
Potawatomi
Ukrainian
Median Female Earnings
Median Female Earnings Comparison
Potawatomi
Ukrainians
$34,739
MEDIAN FEMALE EARNINGS
0.0/ 100
METRIC RATING
317th/ 347
METRIC RANK
$42,015
MEDIAN FEMALE EARNINGS
99.2/ 100
METRIC RATING
90th/ 347
METRIC RANK
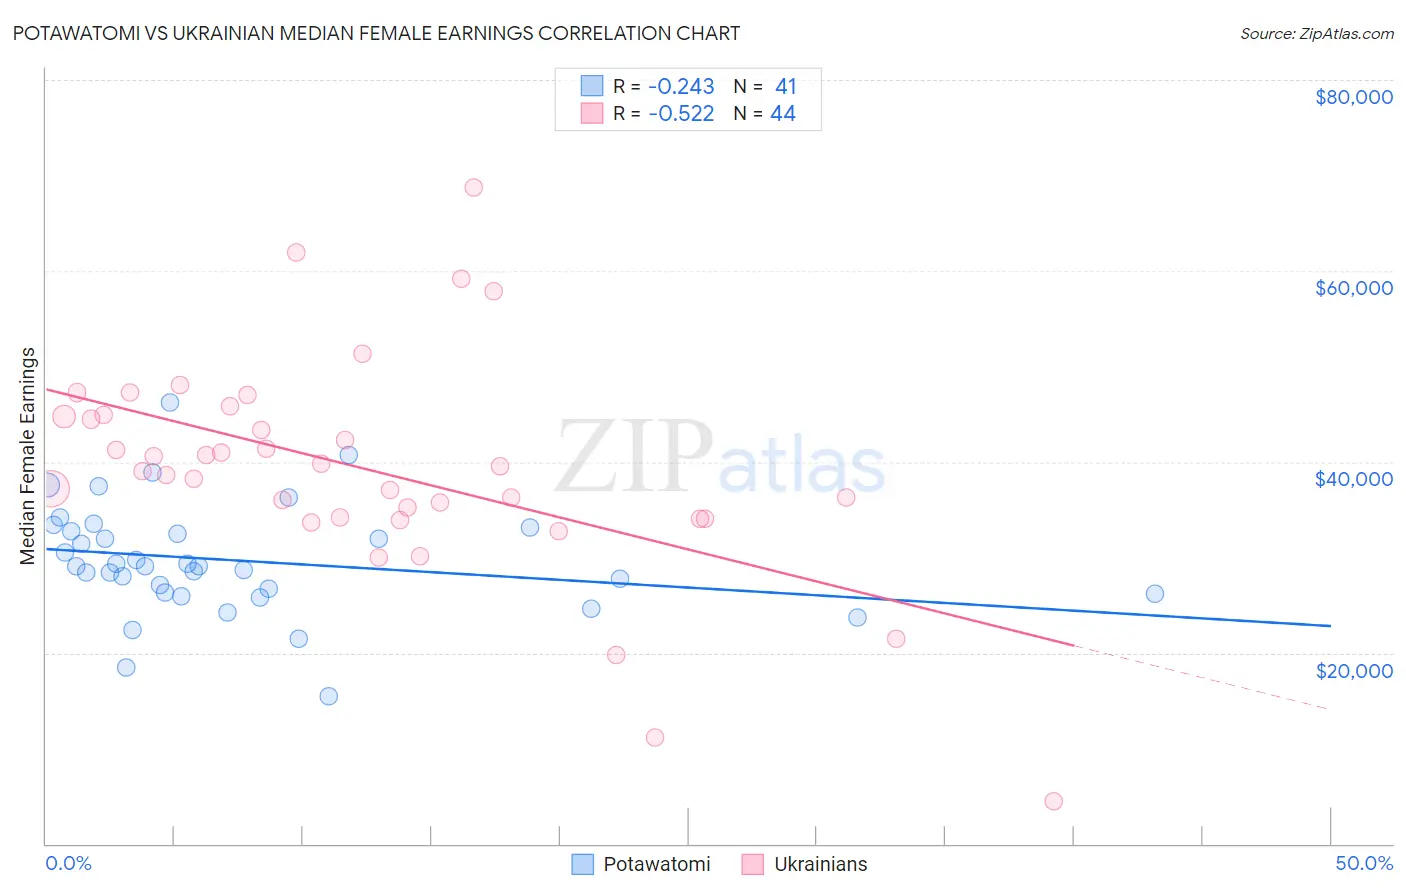
Potawatomi vs Ukrainian Median Female Earnings Correlation Chart
The statistical analysis conducted on geographies consisting of 117,757,146 people shows a weak negative correlation between the proportion of Potawatomi and median female earnings in the United States with a correlation coefficient (R) of -0.243 and weighted average of $34,739. Similarly, the statistical analysis conducted on geographies consisting of 448,339,242 people shows a substantial negative correlation between the proportion of Ukrainians and median female earnings in the United States with a correlation coefficient (R) of -0.522 and weighted average of $42,015, a difference of 20.9%.
Median Female Earnings Correlation Summary
| Measurement | Potawatomi | Ukrainian |
| Minimum | $15,417 | $4,400 |
| Maximum | $46,172 | $68,750 |
| Range | $30,755 | $64,350 |
| Mean | $29,667 | $39,267 |
| Median | $29,066 | $39,270 |
| Interquartile 25% (IQ1) | $26,292 | $34,102 |
| Interquartile 75% (IQ3) | $32,931 | $44,856 |
| Interquartile Range (IQR) | $6,639 | $10,753 |
| Standard Deviation (Sample) | $5,830 | $11,661 |
| Standard Deviation (Population) | $5,758 | $11,527 |
Similar Demographics by Median Female Earnings
Demographics Similar to Potawatomi by Median Female Earnings
In terms of median female earnings, the demographic groups most similar to Potawatomi are Cherokee ($34,742, a difference of 0.010%), Immigrants from Yemen ($34,693, a difference of 0.13%), Pennsylvania German ($34,802, a difference of 0.18%), Shoshone ($34,677, a difference of 0.18%), and Immigrants from Honduras ($34,647, a difference of 0.27%).
| Demographics | Rating | Rank | Median Female Earnings |
| Chippewa | 0.0 /100 | #310 | Tragic $35,003 |
| Ute | 0.0 /100 | #311 | Tragic $34,960 |
| Yaqui | 0.0 /100 | #312 | Tragic $34,943 |
| Cubans | 0.0 /100 | #313 | Tragic $34,942 |
| Apache | 0.0 /100 | #314 | Tragic $34,895 |
| Pennsylvania Germans | 0.0 /100 | #315 | Tragic $34,802 |
| Cherokee | 0.0 /100 | #316 | Tragic $34,742 |
| Potawatomi | 0.0 /100 | #317 | Tragic $34,739 |
| Immigrants | Yemen | 0.0 /100 | #318 | Tragic $34,693 |
| Shoshone | 0.0 /100 | #319 | Tragic $34,677 |
| Immigrants | Honduras | 0.0 /100 | #320 | Tragic $34,647 |
| Hispanics or Latinos | 0.0 /100 | #321 | Tragic $34,421 |
| Chickasaw | 0.0 /100 | #322 | Tragic $34,414 |
| Seminole | 0.0 /100 | #323 | Tragic $34,385 |
| Immigrants | Congo | 0.0 /100 | #324 | Tragic $34,317 |
Demographics Similar to Ukrainians by Median Female Earnings
In terms of median female earnings, the demographic groups most similar to Ukrainians are Immigrants from Western Europe ($41,990, a difference of 0.060%), Immigrants from Afghanistan ($42,055, a difference of 0.10%), Argentinean ($41,952, a difference of 0.15%), Immigrants from Northern Africa ($42,084, a difference of 0.16%), and Immigrants from Grenada ($41,932, a difference of 0.20%).
| Demographics | Rating | Rank | Median Female Earnings |
| Immigrants | Sierra Leone | 99.5 /100 | #83 | Exceptional $42,214 |
| Armenians | 99.5 /100 | #84 | Exceptional $42,212 |
| Laotians | 99.4 /100 | #85 | Exceptional $42,133 |
| Immigrants | St. Vincent and the Grenadines | 99.3 /100 | #86 | Exceptional $42,108 |
| Lithuanians | 99.3 /100 | #87 | Exceptional $42,108 |
| Immigrants | Northern Africa | 99.3 /100 | #88 | Exceptional $42,084 |
| Immigrants | Afghanistan | 99.3 /100 | #89 | Exceptional $42,055 |
| Ukrainians | 99.2 /100 | #90 | Exceptional $42,015 |
| Immigrants | Western Europe | 99.2 /100 | #91 | Exceptional $41,990 |
| Argentineans | 99.1 /100 | #92 | Exceptional $41,952 |
| Immigrants | Grenada | 99.0 /100 | #93 | Exceptional $41,932 |
| Moroccans | 98.9 /100 | #94 | Exceptional $41,872 |
| Immigrants | Netherlands | 98.9 /100 | #95 | Exceptional $41,870 |
| South Africans | 98.8 /100 | #96 | Exceptional $41,825 |
| Immigrants | Hungary | 98.8 /100 | #97 | Exceptional $41,820 |