Cajun vs Immigrants from Costa Rica Median Female Earnings
COMPARE
Cajun
Immigrants from Costa Rica
Median Female Earnings
Median Female Earnings Comparison
Cajuns
Immigrants from Costa Rica
$34,034
MEDIAN FEMALE EARNINGS
0.0/ 100
METRIC RATING
327th/ 347
METRIC RANK
$39,186
MEDIAN FEMALE EARNINGS
25.6/ 100
METRIC RATING
196th/ 347
METRIC RANK
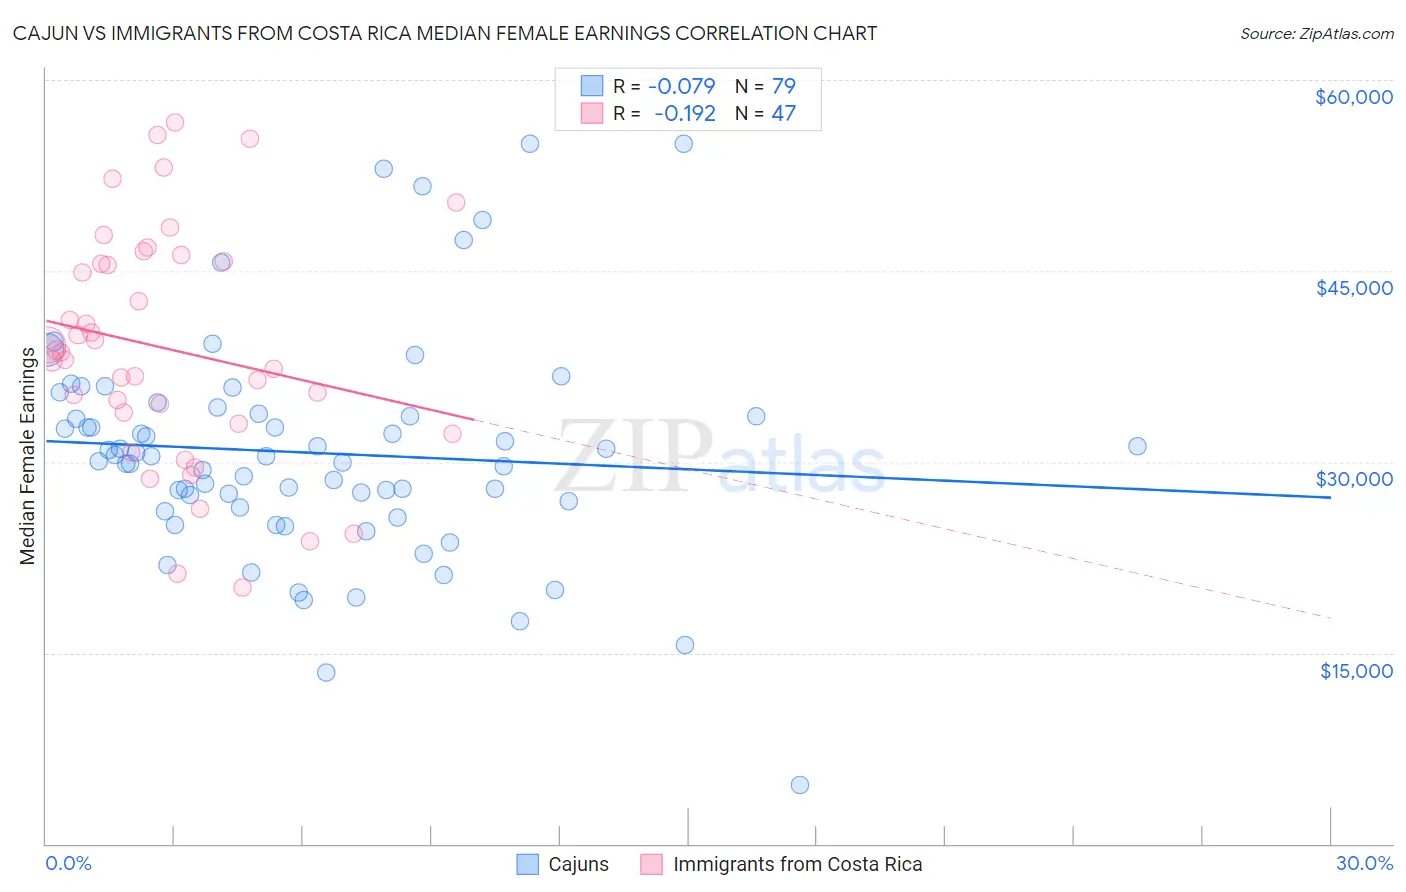
Cajun vs Immigrants from Costa Rica Median Female Earnings Correlation Chart
The statistical analysis conducted on geographies consisting of 149,646,456 people shows a slight negative correlation between the proportion of Cajuns and median female earnings in the United States with a correlation coefficient (R) of -0.079 and weighted average of $34,034. Similarly, the statistical analysis conducted on geographies consisting of 204,263,663 people shows a poor negative correlation between the proportion of Immigrants from Costa Rica and median female earnings in the United States with a correlation coefficient (R) of -0.192 and weighted average of $39,186, a difference of 15.1%.
Median Female Earnings Correlation Summary
| Measurement | Cajun | Immigrants from Costa Rica |
| Minimum | $4,615 | $20,158 |
| Maximum | $55,000 | $56,684 |
| Range | $50,385 | $36,526 |
| Mean | $30,723 | $38,901 |
| Median | $30,456 | $38,633 |
| Interquartile 25% (IQ1) | $26,402 | $33,041 |
| Interquartile 75% (IQ3) | $33,785 | $45,796 |
| Interquartile Range (IQR) | $7,382 | $12,755 |
| Standard Deviation (Sample) | $8,808 | $9,096 |
| Standard Deviation (Population) | $8,752 | $8,998 |
Similar Demographics by Median Female Earnings
Demographics Similar to Cajuns by Median Female Earnings
In terms of median female earnings, the demographic groups most similar to Cajuns are Kiowa ($34,074, a difference of 0.12%), Dutch West Indian ($34,106, a difference of 0.21%), Immigrants from Central America ($33,953, a difference of 0.24%), Hopi ($33,932, a difference of 0.30%), and Menominee ($33,894, a difference of 0.41%).
| Demographics | Rating | Rank | Median Female Earnings |
| Immigrants | Honduras | 0.0 /100 | #320 | Tragic $34,647 |
| Hispanics or Latinos | 0.0 /100 | #321 | Tragic $34,421 |
| Chickasaw | 0.0 /100 | #322 | Tragic $34,414 |
| Seminole | 0.0 /100 | #323 | Tragic $34,385 |
| Immigrants | Congo | 0.0 /100 | #324 | Tragic $34,317 |
| Dutch West Indians | 0.0 /100 | #325 | Tragic $34,106 |
| Kiowa | 0.0 /100 | #326 | Tragic $34,074 |
| Cajuns | 0.0 /100 | #327 | Tragic $34,034 |
| Immigrants | Central America | 0.0 /100 | #328 | Tragic $33,953 |
| Hopi | 0.0 /100 | #329 | Tragic $33,932 |
| Menominee | 0.0 /100 | #330 | Tragic $33,894 |
| Natives/Alaskans | 0.0 /100 | #331 | Tragic $33,806 |
| Choctaw | 0.0 /100 | #332 | Tragic $33,775 |
| Mexicans | 0.0 /100 | #333 | Tragic $33,664 |
| Spanish American Indians | 0.0 /100 | #334 | Tragic $33,625 |
Demographics Similar to Immigrants from Costa Rica by Median Female Earnings
In terms of median female earnings, the demographic groups most similar to Immigrants from Costa Rica are Assyrian/Chaldean/Syriac ($39,159, a difference of 0.070%), Uruguayan ($39,228, a difference of 0.11%), Ecuadorian ($39,117, a difference of 0.18%), Icelander ($39,109, a difference of 0.20%), and Irish ($39,291, a difference of 0.27%).
| Demographics | Rating | Rank | Median Female Earnings |
| Senegalese | 34.2 /100 | #189 | Fair $39,384 |
| Puget Sound Salish | 33.9 /100 | #190 | Fair $39,376 |
| Immigrants | Western Africa | 32.7 /100 | #191 | Fair $39,351 |
| Immigrants | Immigrants | 31.7 /100 | #192 | Fair $39,328 |
| Immigrants | Nigeria | 30.2 /100 | #193 | Fair $39,294 |
| Irish | 30.0 /100 | #194 | Fair $39,291 |
| Uruguayans | 27.3 /100 | #195 | Fair $39,228 |
| Immigrants | Costa Rica | 25.6 /100 | #196 | Fair $39,186 |
| Assyrians/Chaldeans/Syriacs | 24.6 /100 | #197 | Fair $39,159 |
| Ecuadorians | 23.0 /100 | #198 | Fair $39,117 |
| Icelanders | 22.7 /100 | #199 | Fair $39,109 |
| Immigrants | Panama | 20.6 /100 | #200 | Fair $39,049 |
| Panamanians | 20.6 /100 | #201 | Fair $39,049 |
| Slovaks | 19.9 /100 | #202 | Poor $39,029 |
| Czechs | 18.7 /100 | #203 | Poor $38,992 |