Honduran vs Immigrants from Costa Rica Median Female Earnings
COMPARE
Honduran
Immigrants from Costa Rica
Median Female Earnings
Median Female Earnings Comparison
Hondurans
Immigrants from Costa Rica
$35,013
MEDIAN FEMALE EARNINGS
0.0/ 100
METRIC RATING
309th/ 347
METRIC RANK
$39,186
MEDIAN FEMALE EARNINGS
25.6/ 100
METRIC RATING
196th/ 347
METRIC RANK
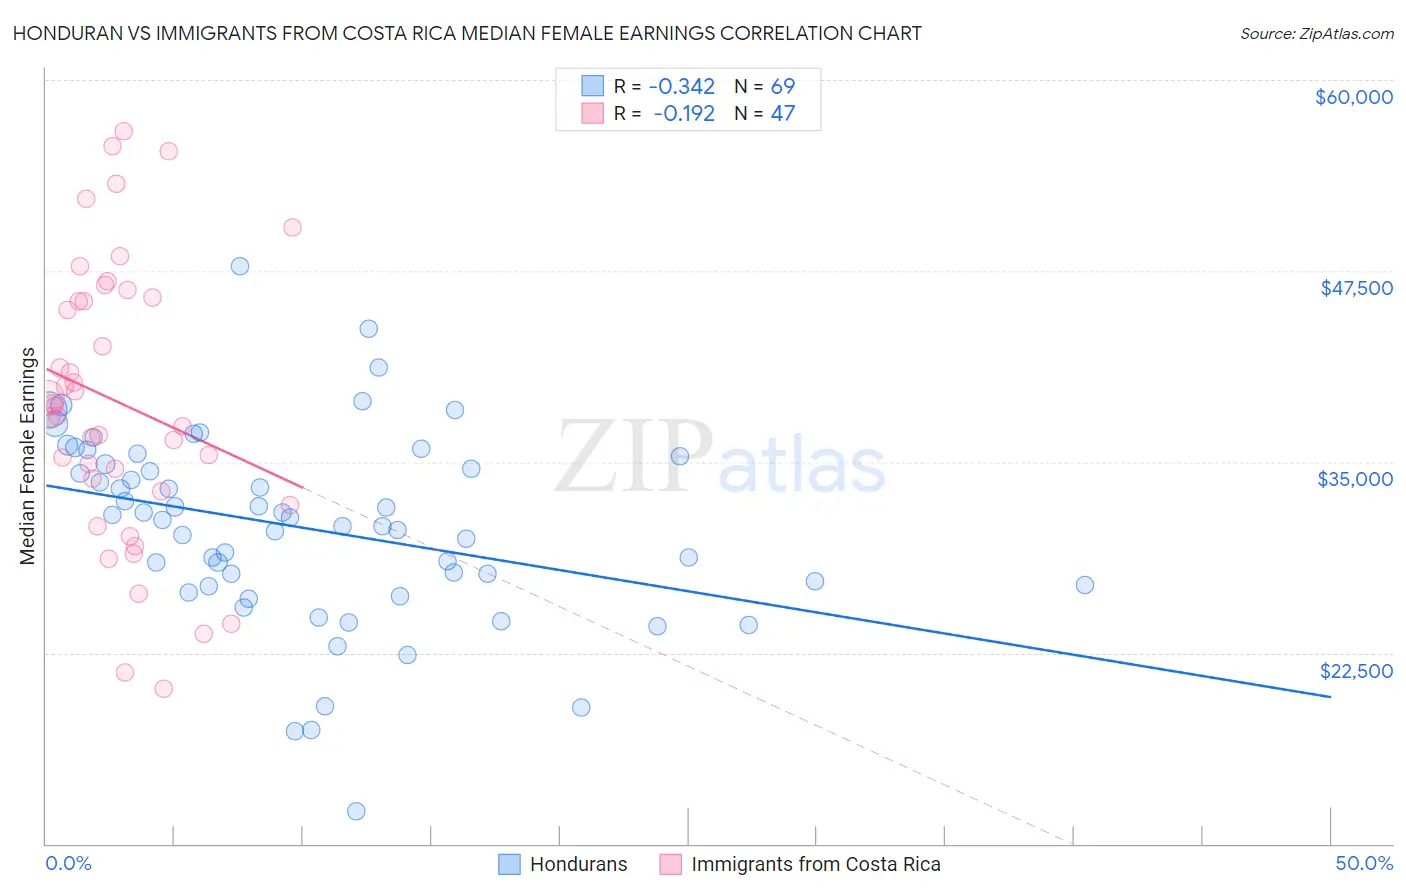
Honduran vs Immigrants from Costa Rica Median Female Earnings Correlation Chart
The statistical analysis conducted on geographies consisting of 357,702,253 people shows a mild negative correlation between the proportion of Hondurans and median female earnings in the United States with a correlation coefficient (R) of -0.342 and weighted average of $35,013. Similarly, the statistical analysis conducted on geographies consisting of 204,263,663 people shows a poor negative correlation between the proportion of Immigrants from Costa Rica and median female earnings in the United States with a correlation coefficient (R) of -0.192 and weighted average of $39,186, a difference of 11.9%.
Median Female Earnings Correlation Summary
| Measurement | Honduran | Immigrants from Costa Rica |
| Minimum | $12,102 | $20,158 |
| Maximum | $47,798 | $56,684 |
| Range | $35,696 | $36,526 |
| Mean | $30,670 | $38,901 |
| Median | $31,162 | $38,633 |
| Interquartile 25% (IQ1) | $26,901 | $33,041 |
| Interquartile 75% (IQ3) | $35,123 | $45,796 |
| Interquartile Range (IQR) | $8,221 | $12,755 |
| Standard Deviation (Sample) | $6,330 | $9,096 |
| Standard Deviation (Population) | $6,284 | $8,998 |
Similar Demographics by Median Female Earnings
Demographics Similar to Hondurans by Median Female Earnings
In terms of median female earnings, the demographic groups most similar to Hondurans are Chippewa ($35,003, a difference of 0.030%), Immigrants from Bahamas ($35,027, a difference of 0.040%), Sioux ($35,063, a difference of 0.14%), Ute ($34,960, a difference of 0.15%), and Yaqui ($34,943, a difference of 0.20%).
| Demographics | Rating | Rank | Median Female Earnings |
| Blacks/African Americans | 0.0 /100 | #302 | Tragic $35,315 |
| Immigrants | Latin America | 0.0 /100 | #303 | Tragic $35,307 |
| Crow | 0.0 /100 | #304 | Tragic $35,266 |
| Bahamians | 0.0 /100 | #305 | Tragic $35,125 |
| Fijians | 0.0 /100 | #306 | Tragic $35,114 |
| Sioux | 0.0 /100 | #307 | Tragic $35,063 |
| Immigrants | Bahamas | 0.0 /100 | #308 | Tragic $35,027 |
| Hondurans | 0.0 /100 | #309 | Tragic $35,013 |
| Chippewa | 0.0 /100 | #310 | Tragic $35,003 |
| Ute | 0.0 /100 | #311 | Tragic $34,960 |
| Yaqui | 0.0 /100 | #312 | Tragic $34,943 |
| Cubans | 0.0 /100 | #313 | Tragic $34,942 |
| Apache | 0.0 /100 | #314 | Tragic $34,895 |
| Pennsylvania Germans | 0.0 /100 | #315 | Tragic $34,802 |
| Cherokee | 0.0 /100 | #316 | Tragic $34,742 |
Demographics Similar to Immigrants from Costa Rica by Median Female Earnings
In terms of median female earnings, the demographic groups most similar to Immigrants from Costa Rica are Assyrian/Chaldean/Syriac ($39,159, a difference of 0.070%), Uruguayan ($39,228, a difference of 0.11%), Ecuadorian ($39,117, a difference of 0.18%), Icelander ($39,109, a difference of 0.20%), and Irish ($39,291, a difference of 0.27%).
| Demographics | Rating | Rank | Median Female Earnings |
| Senegalese | 34.2 /100 | #189 | Fair $39,384 |
| Puget Sound Salish | 33.9 /100 | #190 | Fair $39,376 |
| Immigrants | Western Africa | 32.7 /100 | #191 | Fair $39,351 |
| Immigrants | Immigrants | 31.7 /100 | #192 | Fair $39,328 |
| Immigrants | Nigeria | 30.2 /100 | #193 | Fair $39,294 |
| Irish | 30.0 /100 | #194 | Fair $39,291 |
| Uruguayans | 27.3 /100 | #195 | Fair $39,228 |
| Immigrants | Costa Rica | 25.6 /100 | #196 | Fair $39,186 |
| Assyrians/Chaldeans/Syriacs | 24.6 /100 | #197 | Fair $39,159 |
| Ecuadorians | 23.0 /100 | #198 | Fair $39,117 |
| Icelanders | 22.7 /100 | #199 | Fair $39,109 |
| Immigrants | Panama | 20.6 /100 | #200 | Fair $39,049 |
| Panamanians | 20.6 /100 | #201 | Fair $39,049 |
| Slovaks | 19.9 /100 | #202 | Poor $39,029 |
| Czechs | 18.7 /100 | #203 | Poor $38,992 |