Immigrants from Western Africa vs Bolivian Median Female Earnings
COMPARE
Immigrants from Western Africa
Bolivian
Median Female Earnings
Median Female Earnings Comparison
Immigrants from Western Africa
Bolivians
$39,351
MEDIAN FEMALE EARNINGS
32.7/ 100
METRIC RATING
191st/ 347
METRIC RANK
$43,445
MEDIAN FEMALE EARNINGS
100.0/ 100
METRIC RATING
47th/ 347
METRIC RANK
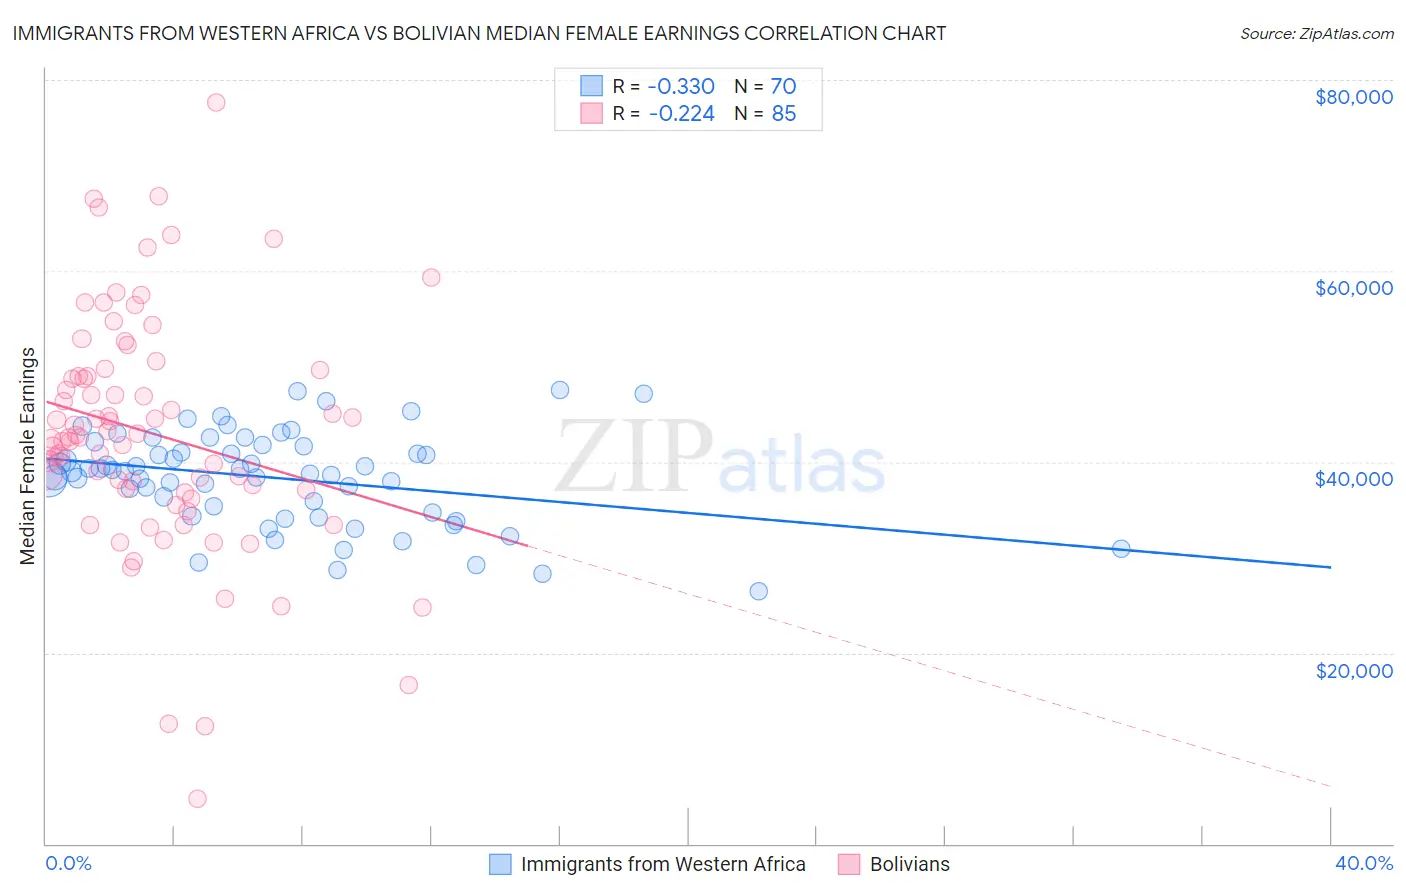
Immigrants from Western Africa vs Bolivian Median Female Earnings Correlation Chart
The statistical analysis conducted on geographies consisting of 357,790,010 people shows a mild negative correlation between the proportion of Immigrants from Western Africa and median female earnings in the United States with a correlation coefficient (R) of -0.330 and weighted average of $39,351. Similarly, the statistical analysis conducted on geographies consisting of 184,667,503 people shows a weak negative correlation between the proportion of Bolivians and median female earnings in the United States with a correlation coefficient (R) of -0.224 and weighted average of $43,445, a difference of 10.4%.
Median Female Earnings Correlation Summary
| Measurement | Immigrants from Western Africa | Bolivian |
| Minimum | $26,446 | $4,682 |
| Maximum | $47,567 | $77,679 |
| Range | $21,121 | $72,997 |
| Mean | $38,325 | $42,989 |
| Median | $39,007 | $42,606 |
| Interquartile 25% (IQ1) | $34,756 | $36,934 |
| Interquartile 75% (IQ3) | $41,620 | $49,332 |
| Interquartile Range (IQR) | $6,864 | $12,397 |
| Standard Deviation (Sample) | $4,866 | $12,507 |
| Standard Deviation (Population) | $4,831 | $12,433 |
Similar Demographics by Median Female Earnings
Demographics Similar to Immigrants from Western Africa by Median Female Earnings
In terms of median female earnings, the demographic groups most similar to Immigrants from Western Africa are Puget Sound Salish ($39,376, a difference of 0.060%), Immigrants ($39,328, a difference of 0.060%), Senegalese ($39,384, a difference of 0.080%), Immigrants from Nigeria ($39,294, a difference of 0.14%), and Irish ($39,291, a difference of 0.15%).
| Demographics | Rating | Rank | Median Female Earnings |
| Europeans | 37.7 /100 | #184 | Fair $39,457 |
| Immigrants | West Indies | 36.9 /100 | #185 | Fair $39,441 |
| Colombians | 36.9 /100 | #186 | Fair $39,439 |
| Swedes | 36.0 /100 | #187 | Fair $39,421 |
| Bermudans | 35.9 /100 | #188 | Fair $39,418 |
| Senegalese | 34.2 /100 | #189 | Fair $39,384 |
| Puget Sound Salish | 33.9 /100 | #190 | Fair $39,376 |
| Immigrants | Western Africa | 32.7 /100 | #191 | Fair $39,351 |
| Immigrants | Immigrants | 31.7 /100 | #192 | Fair $39,328 |
| Immigrants | Nigeria | 30.2 /100 | #193 | Fair $39,294 |
| Irish | 30.0 /100 | #194 | Fair $39,291 |
| Uruguayans | 27.3 /100 | #195 | Fair $39,228 |
| Immigrants | Costa Rica | 25.6 /100 | #196 | Fair $39,186 |
| Assyrians/Chaldeans/Syriacs | 24.6 /100 | #197 | Fair $39,159 |
| Ecuadorians | 23.0 /100 | #198 | Fair $39,117 |
Demographics Similar to Bolivians by Median Female Earnings
In terms of median female earnings, the demographic groups most similar to Bolivians are Immigrants from Bolivia ($43,467, a difference of 0.050%), Immigrants from Indonesia ($43,412, a difference of 0.070%), Immigrants from Serbia ($43,385, a difference of 0.14%), Immigrants from Europe ($43,523, a difference of 0.18%), and Immigrants from Uzbekistan ($43,363, a difference of 0.19%).
| Demographics | Rating | Rank | Median Female Earnings |
| Immigrants | Malaysia | 100.0 /100 | #40 | Exceptional $43,835 |
| Bhutanese | 100.0 /100 | #41 | Exceptional $43,648 |
| Immigrants | Denmark | 100.0 /100 | #42 | Exceptional $43,646 |
| Bulgarians | 100.0 /100 | #43 | Exceptional $43,638 |
| Immigrants | Czechoslovakia | 100.0 /100 | #44 | Exceptional $43,571 |
| Immigrants | Europe | 100.0 /100 | #45 | Exceptional $43,523 |
| Immigrants | Bolivia | 100.0 /100 | #46 | Exceptional $43,467 |
| Bolivians | 100.0 /100 | #47 | Exceptional $43,445 |
| Immigrants | Indonesia | 100.0 /100 | #48 | Exceptional $43,412 |
| Immigrants | Serbia | 100.0 /100 | #49 | Exceptional $43,385 |
| Immigrants | Uzbekistan | 100.0 /100 | #50 | Exceptional $43,363 |
| Maltese | 100.0 /100 | #51 | Exceptional $43,357 |
| Immigrants | Lithuania | 99.9 /100 | #52 | Exceptional $43,317 |
| Immigrants | Eastern Europe | 99.9 /100 | #53 | Exceptional $43,309 |
| Australians | 99.9 /100 | #54 | Exceptional $43,308 |