Immigrants from Norway vs Bolivian Median Female Earnings
COMPARE
Immigrants from Norway
Bolivian
Median Female Earnings
Median Female Earnings Comparison
Immigrants from Norway
Bolivians
$42,837
MEDIAN FEMALE EARNINGS
99.9/ 100
METRIC RATING
66th/ 347
METRIC RANK
$43,445
MEDIAN FEMALE EARNINGS
100.0/ 100
METRIC RATING
47th/ 347
METRIC RANK
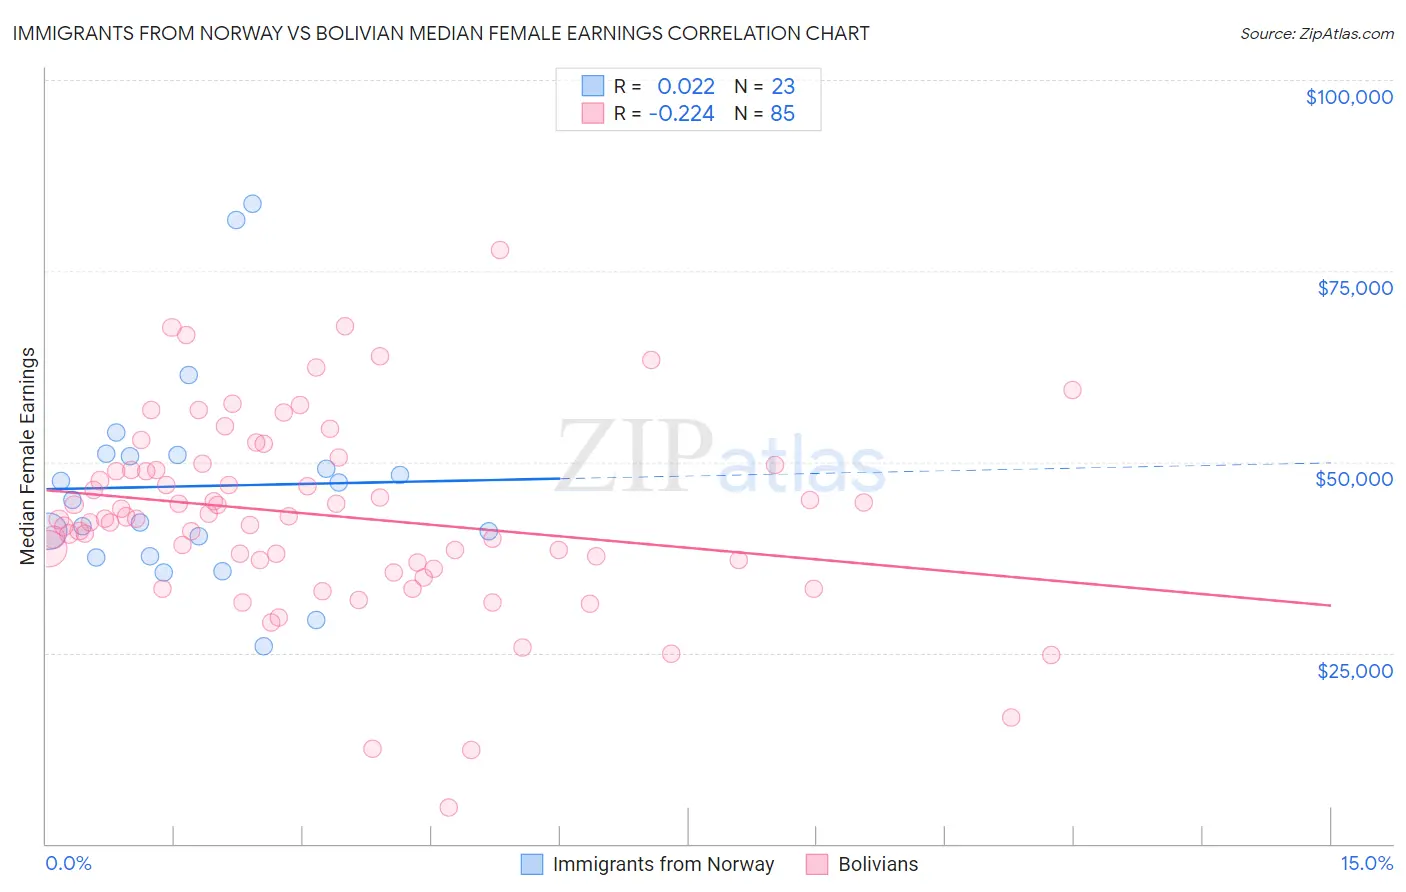
Immigrants from Norway vs Bolivian Median Female Earnings Correlation Chart
The statistical analysis conducted on geographies consisting of 116,697,364 people shows no correlation between the proportion of Immigrants from Norway and median female earnings in the United States with a correlation coefficient (R) of 0.022 and weighted average of $42,837. Similarly, the statistical analysis conducted on geographies consisting of 184,667,503 people shows a weak negative correlation between the proportion of Bolivians and median female earnings in the United States with a correlation coefficient (R) of -0.224 and weighted average of $43,445, a difference of 1.4%.
Median Female Earnings Correlation Summary
| Measurement | Immigrants from Norway | Bolivian |
| Minimum | $25,783 | $4,682 |
| Maximum | $83,727 | $77,679 |
| Range | $57,944 | $72,997 |
| Mean | $46,834 | $42,989 |
| Median | $44,998 | $42,606 |
| Interquartile 25% (IQ1) | $37,628 | $36,934 |
| Interquartile 75% (IQ3) | $50,939 | $49,332 |
| Interquartile Range (IQR) | $13,311 | $12,397 |
| Standard Deviation (Sample) | $13,874 | $12,507 |
| Standard Deviation (Population) | $13,569 | $12,433 |
Demographics Similar to Immigrants from Norway and Bolivians by Median Female Earnings
In terms of median female earnings, the demographic groups most similar to Immigrants from Norway are Sierra Leonean ($42,868, a difference of 0.070%), Immigrants from Pakistan ($43,052, a difference of 0.50%), Immigrants from Ukraine ($43,069, a difference of 0.54%), Afghan ($43,077, a difference of 0.56%), and Immigrants from Bulgaria ($43,085, a difference of 0.58%). Similarly, the demographic groups most similar to Bolivians are Immigrants from Bolivia ($43,467, a difference of 0.050%), Immigrants from Indonesia ($43,412, a difference of 0.070%), Immigrants from Serbia ($43,385, a difference of 0.14%), Immigrants from Uzbekistan ($43,363, a difference of 0.19%), and Maltese ($43,357, a difference of 0.20%).
| Demographics | Rating | Rank | Median Female Earnings |
| Immigrants | Bolivia | 100.0 /100 | #46 | Exceptional $43,467 |
| Bolivians | 100.0 /100 | #47 | Exceptional $43,445 |
| Immigrants | Indonesia | 100.0 /100 | #48 | Exceptional $43,412 |
| Immigrants | Serbia | 100.0 /100 | #49 | Exceptional $43,385 |
| Immigrants | Uzbekistan | 100.0 /100 | #50 | Exceptional $43,363 |
| Maltese | 100.0 /100 | #51 | Exceptional $43,357 |
| Immigrants | Lithuania | 99.9 /100 | #52 | Exceptional $43,317 |
| Immigrants | Eastern Europe | 99.9 /100 | #53 | Exceptional $43,309 |
| Australians | 99.9 /100 | #54 | Exceptional $43,308 |
| Egyptians | 99.9 /100 | #55 | Exceptional $43,305 |
| Immigrants | Croatia | 99.9 /100 | #56 | Exceptional $43,258 |
| Ethiopians | 99.9 /100 | #57 | Exceptional $43,243 |
| Paraguayans | 99.9 /100 | #58 | Exceptional $43,173 |
| Estonians | 99.9 /100 | #59 | Exceptional $43,106 |
| Immigrants | Latvia | 99.9 /100 | #60 | Exceptional $43,099 |
| Immigrants | Bulgaria | 99.9 /100 | #61 | Exceptional $43,085 |
| Afghans | 99.9 /100 | #62 | Exceptional $43,077 |
| Immigrants | Ukraine | 99.9 /100 | #63 | Exceptional $43,069 |
| Immigrants | Pakistan | 99.9 /100 | #64 | Exceptional $43,052 |
| Sierra Leoneans | 99.9 /100 | #65 | Exceptional $42,868 |
| Immigrants | Norway | 99.9 /100 | #66 | Exceptional $42,837 |