Seminole vs Immigrants from Malaysia Median Household Income
COMPARE
Seminole
Immigrants from Malaysia
Median Household Income
Median Household Income Comparison
Seminole
Immigrants from Malaysia
$69,420
MEDIAN HOUSEHOLD INCOME
0.0/ 100
METRIC RATING
325th/ 347
METRIC RANK
$96,292
MEDIAN HOUSEHOLD INCOME
99.9/ 100
METRIC RATING
49th/ 347
METRIC RANK
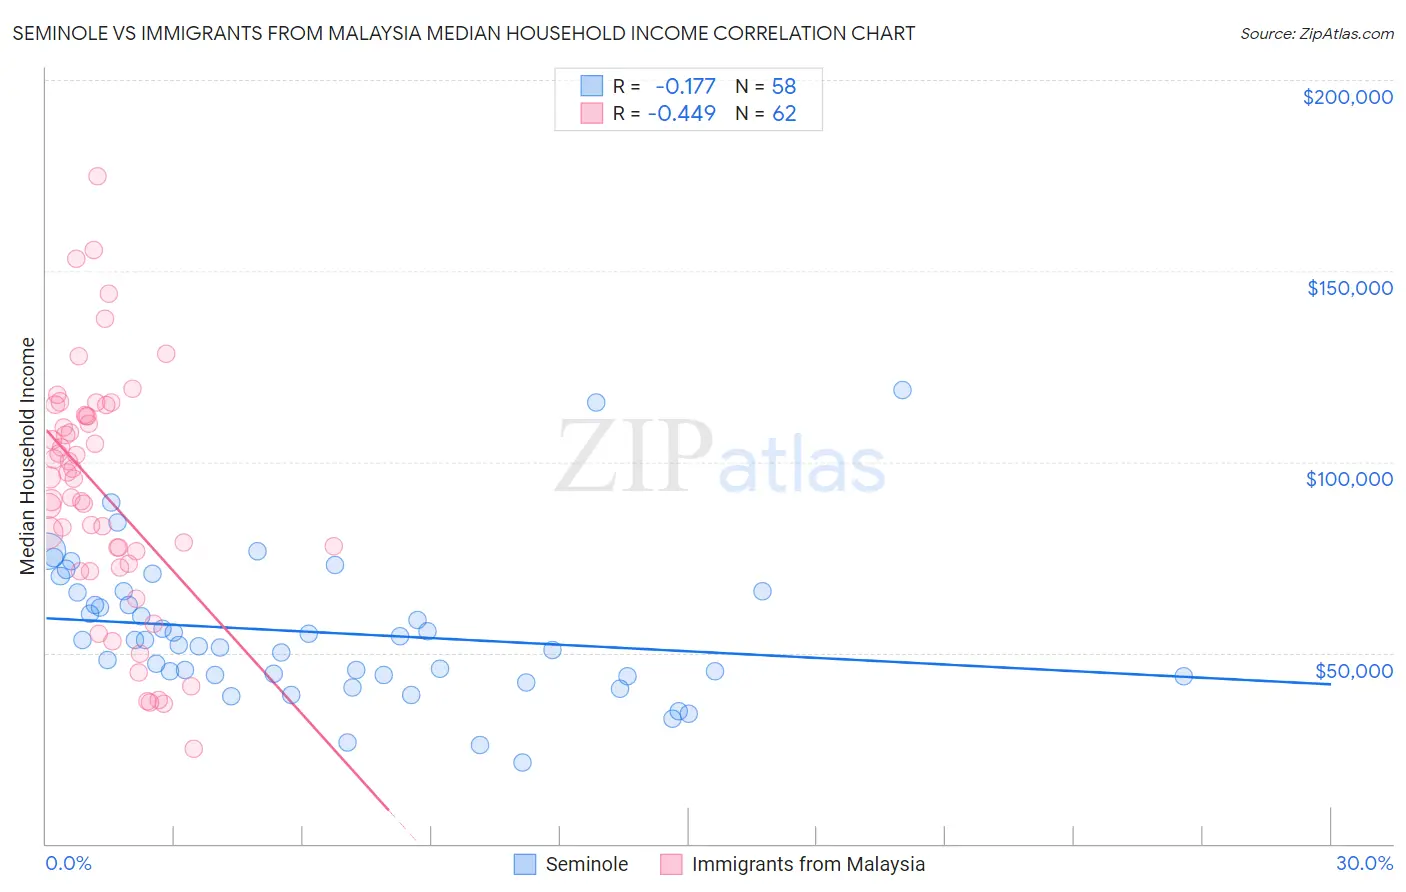
Seminole vs Immigrants from Malaysia Median Household Income Correlation Chart
The statistical analysis conducted on geographies consisting of 118,297,671 people shows a poor negative correlation between the proportion of Seminole and median household income in the United States with a correlation coefficient (R) of -0.177 and weighted average of $69,420. Similarly, the statistical analysis conducted on geographies consisting of 197,902,730 people shows a moderate negative correlation between the proportion of Immigrants from Malaysia and median household income in the United States with a correlation coefficient (R) of -0.449 and weighted average of $96,292, a difference of 38.7%.
Median Household Income Correlation Summary
| Measurement | Seminole | Immigrants from Malaysia |
| Minimum | $21,429 | $25,000 |
| Maximum | $118,750 | $174,680 |
| Range | $97,321 | $149,680 |
| Mean | $55,357 | $92,009 |
| Median | $52,689 | $95,719 |
| Interquartile 25% (IQ1) | $44,050 | $73,336 |
| Interquartile 75% (IQ3) | $65,850 | $111,923 |
| Interquartile Range (IQR) | $21,800 | $38,587 |
| Standard Deviation (Sample) | $18,667 | $31,412 |
| Standard Deviation (Population) | $18,505 | $31,158 |
Similar Demographics by Median Household Income
Demographics Similar to Seminole by Median Household Income
In terms of median household income, the demographic groups most similar to Seminole are Yup'ik ($69,695, a difference of 0.40%), Bahamian ($69,726, a difference of 0.44%), Choctaw ($69,947, a difference of 0.76%), Chickasaw ($70,005, a difference of 0.84%), and Colville ($70,094, a difference of 0.97%).
| Demographics | Rating | Rank | Median Household Income |
| Chippewa | 0.0 /100 | #318 | Tragic $70,539 |
| Immigrants | Dominican Republic | 0.0 /100 | #319 | Tragic $70,208 |
| Colville | 0.0 /100 | #320 | Tragic $70,094 |
| Chickasaw | 0.0 /100 | #321 | Tragic $70,005 |
| Choctaw | 0.0 /100 | #322 | Tragic $69,947 |
| Bahamians | 0.0 /100 | #323 | Tragic $69,726 |
| Yup'ik | 0.0 /100 | #324 | Tragic $69,695 |
| Seminole | 0.0 /100 | #325 | Tragic $69,420 |
| Yuman | 0.0 /100 | #326 | Tragic $68,743 |
| Immigrants | Cuba | 0.0 /100 | #327 | Tragic $68,461 |
| Menominee | 0.0 /100 | #328 | Tragic $68,423 |
| Dutch West Indians | 0.0 /100 | #329 | Tragic $68,412 |
| Arapaho | 0.0 /100 | #330 | Tragic $67,965 |
| Natives/Alaskans | 0.0 /100 | #331 | Tragic $67,879 |
| Sioux | 0.0 /100 | #332 | Tragic $67,792 |
Demographics Similar to Immigrants from Malaysia by Median Household Income
In terms of median household income, the demographic groups most similar to Immigrants from Malaysia are Bulgarian ($96,290, a difference of 0.0%), Cambodian ($96,324, a difference of 0.030%), Immigrants from Russia ($96,378, a difference of 0.090%), Australian ($96,490, a difference of 0.21%), and Israeli ($96,552, a difference of 0.27%).
| Demographics | Rating | Rank | Median Household Income |
| Immigrants | Lithuania | 99.9 /100 | #42 | Exceptional $96,836 |
| Immigrants | France | 99.9 /100 | #43 | Exceptional $96,743 |
| Immigrants | Greece | 99.9 /100 | #44 | Exceptional $96,675 |
| Israelis | 99.9 /100 | #45 | Exceptional $96,552 |
| Australians | 99.9 /100 | #46 | Exceptional $96,490 |
| Immigrants | Russia | 99.9 /100 | #47 | Exceptional $96,378 |
| Cambodians | 99.9 /100 | #48 | Exceptional $96,324 |
| Immigrants | Malaysia | 99.9 /100 | #49 | Exceptional $96,292 |
| Bulgarians | 99.9 /100 | #50 | Exceptional $96,290 |
| Estonians | 99.9 /100 | #51 | Exceptional $95,930 |
| Immigrants | South Africa | 99.9 /100 | #52 | Exceptional $95,800 |
| Paraguayans | 99.9 /100 | #53 | Exceptional $95,737 |
| Egyptians | 99.9 /100 | #54 | Exceptional $95,673 |
| Immigrants | Czechoslovakia | 99.9 /100 | #55 | Exceptional $95,319 |
| Immigrants | Austria | 99.9 /100 | #56 | Exceptional $95,277 |