Seminole vs Immigrants from France Median Household Income
COMPARE
Seminole
Immigrants from France
Median Household Income
Median Household Income Comparison
Seminole
Immigrants from France
$69,420
MEDIAN HOUSEHOLD INCOME
0.0/ 100
METRIC RATING
325th/ 347
METRIC RANK
$96,743
MEDIAN HOUSEHOLD INCOME
99.9/ 100
METRIC RATING
43rd/ 347
METRIC RANK
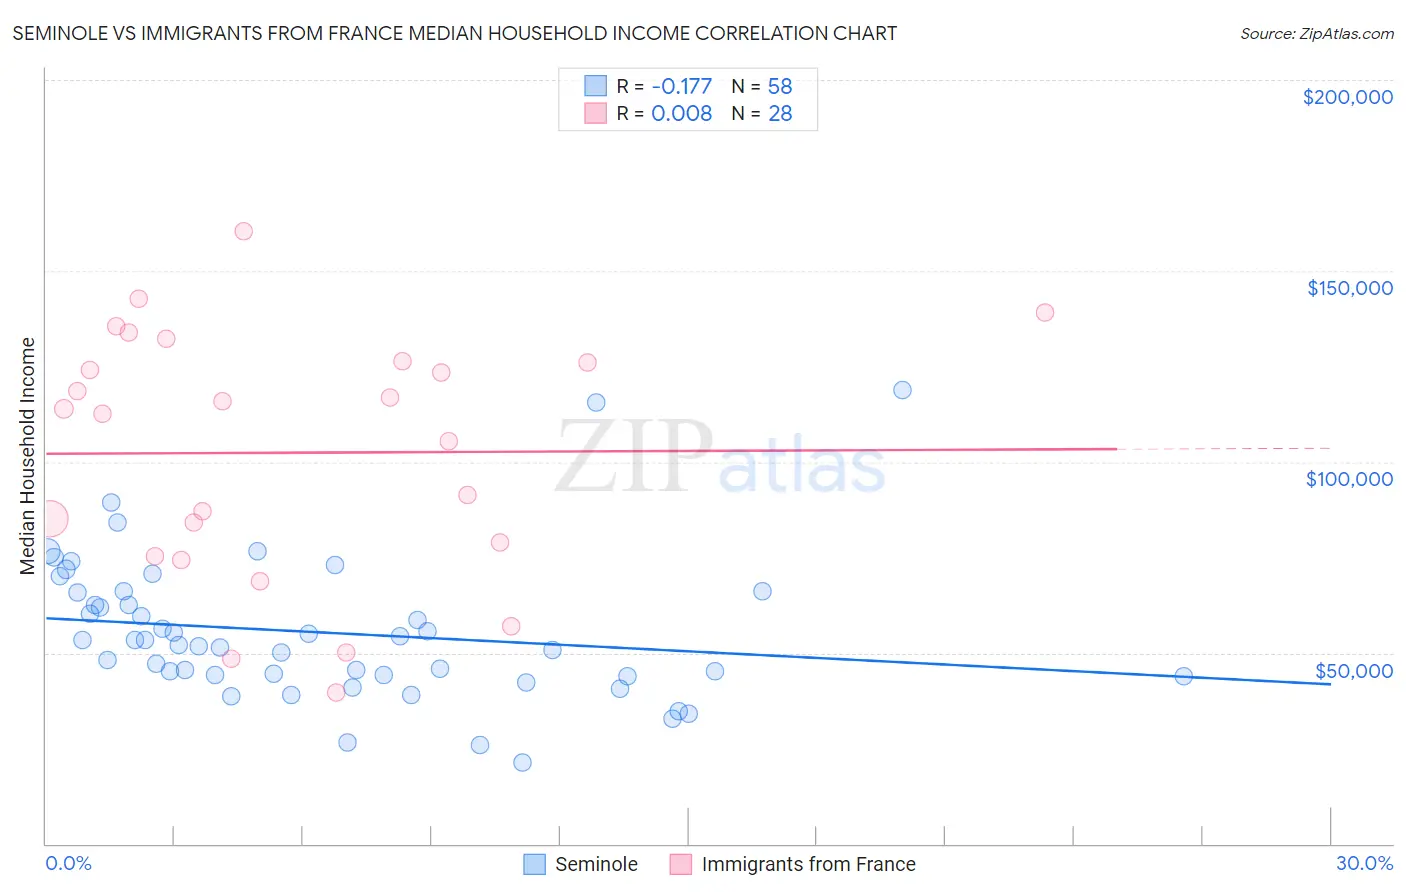
Seminole vs Immigrants from France Median Household Income Correlation Chart
The statistical analysis conducted on geographies consisting of 118,297,671 people shows a poor negative correlation between the proportion of Seminole and median household income in the United States with a correlation coefficient (R) of -0.177 and weighted average of $69,420. Similarly, the statistical analysis conducted on geographies consisting of 287,829,118 people shows no correlation between the proportion of Immigrants from France and median household income in the United States with a correlation coefficient (R) of 0.008 and weighted average of $96,743, a difference of 39.4%.
Median Household Income Correlation Summary
| Measurement | Seminole | Immigrants from France |
| Minimum | $21,429 | $39,667 |
| Maximum | $118,750 | $160,542 |
| Range | $97,321 | $120,875 |
| Mean | $55,357 | $102,392 |
| Median | $52,689 | $113,241 |
| Interquartile 25% (IQ1) | $44,050 | $77,070 |
| Interquartile 75% (IQ3) | $65,850 | $126,188 |
| Interquartile Range (IQR) | $21,800 | $49,118 |
| Standard Deviation (Sample) | $18,667 | $32,282 |
| Standard Deviation (Population) | $18,505 | $31,701 |
Similar Demographics by Median Household Income
Demographics Similar to Seminole by Median Household Income
In terms of median household income, the demographic groups most similar to Seminole are Yup'ik ($69,695, a difference of 0.40%), Bahamian ($69,726, a difference of 0.44%), Choctaw ($69,947, a difference of 0.76%), Chickasaw ($70,005, a difference of 0.84%), and Colville ($70,094, a difference of 0.97%).
| Demographics | Rating | Rank | Median Household Income |
| Chippewa | 0.0 /100 | #318 | Tragic $70,539 |
| Immigrants | Dominican Republic | 0.0 /100 | #319 | Tragic $70,208 |
| Colville | 0.0 /100 | #320 | Tragic $70,094 |
| Chickasaw | 0.0 /100 | #321 | Tragic $70,005 |
| Choctaw | 0.0 /100 | #322 | Tragic $69,947 |
| Bahamians | 0.0 /100 | #323 | Tragic $69,726 |
| Yup'ik | 0.0 /100 | #324 | Tragic $69,695 |
| Seminole | 0.0 /100 | #325 | Tragic $69,420 |
| Yuman | 0.0 /100 | #326 | Tragic $68,743 |
| Immigrants | Cuba | 0.0 /100 | #327 | Tragic $68,461 |
| Menominee | 0.0 /100 | #328 | Tragic $68,423 |
| Dutch West Indians | 0.0 /100 | #329 | Tragic $68,412 |
| Arapaho | 0.0 /100 | #330 | Tragic $67,965 |
| Natives/Alaskans | 0.0 /100 | #331 | Tragic $67,879 |
| Sioux | 0.0 /100 | #332 | Tragic $67,792 |
Demographics Similar to Immigrants from France by Median Household Income
In terms of median household income, the demographic groups most similar to Immigrants from France are Immigrants from Greece ($96,675, a difference of 0.070%), Immigrants from Lithuania ($96,836, a difference of 0.10%), Israeli ($96,552, a difference of 0.20%), Immigrants from Turkey ($96,964, a difference of 0.23%), and Australian ($96,490, a difference of 0.26%).
| Demographics | Rating | Rank | Median Household Income |
| Immigrants | Pakistan | 100.0 /100 | #36 | Exceptional $97,528 |
| Latvians | 100.0 /100 | #37 | Exceptional $97,311 |
| Immigrants | Indonesia | 100.0 /100 | #38 | Exceptional $97,297 |
| Afghans | 100.0 /100 | #39 | Exceptional $97,026 |
| Maltese | 100.0 /100 | #40 | Exceptional $97,015 |
| Immigrants | Turkey | 100.0 /100 | #41 | Exceptional $96,964 |
| Immigrants | Lithuania | 99.9 /100 | #42 | Exceptional $96,836 |
| Immigrants | France | 99.9 /100 | #43 | Exceptional $96,743 |
| Immigrants | Greece | 99.9 /100 | #44 | Exceptional $96,675 |
| Israelis | 99.9 /100 | #45 | Exceptional $96,552 |
| Australians | 99.9 /100 | #46 | Exceptional $96,490 |
| Immigrants | Russia | 99.9 /100 | #47 | Exceptional $96,378 |
| Cambodians | 99.9 /100 | #48 | Exceptional $96,324 |
| Immigrants | Malaysia | 99.9 /100 | #49 | Exceptional $96,292 |
| Bulgarians | 99.9 /100 | #50 | Exceptional $96,290 |