Scotch-Irish vs Macedonian Median Female Earnings
COMPARE
Scotch-Irish
Macedonian
Median Female Earnings
Median Female Earnings Comparison
Scotch-Irish
Macedonians
$37,383
MEDIAN FEMALE EARNINGS
0.8/ 100
METRIC RATING
259th/ 347
METRIC RANK
$41,286
MEDIAN FEMALE EARNINGS
96.4/ 100
METRIC RATING
113th/ 347
METRIC RANK
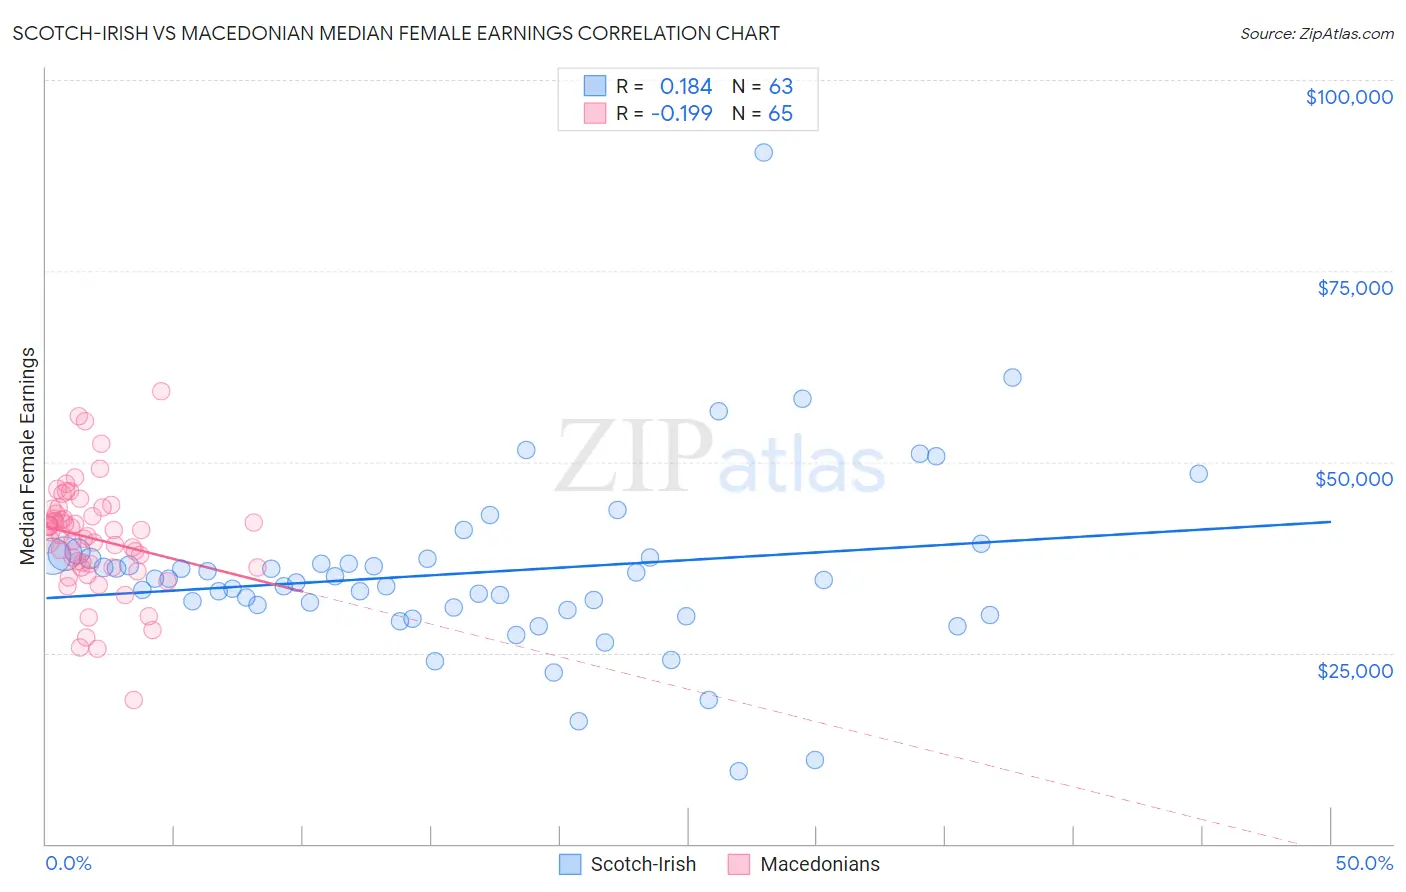
Scotch-Irish vs Macedonian Median Female Earnings Correlation Chart
The statistical analysis conducted on geographies consisting of 547,379,253 people shows a poor positive correlation between the proportion of Scotch-Irish and median female earnings in the United States with a correlation coefficient (R) of 0.184 and weighted average of $37,383. Similarly, the statistical analysis conducted on geographies consisting of 132,580,469 people shows a poor negative correlation between the proportion of Macedonians and median female earnings in the United States with a correlation coefficient (R) of -0.199 and weighted average of $41,286, a difference of 10.4%.
Median Female Earnings Correlation Summary
| Measurement | Scotch-Irish | Macedonian |
| Minimum | $9,426 | $18,750 |
| Maximum | $90,469 | $59,207 |
| Range | $81,043 | $40,457 |
| Mean | $35,513 | $39,979 |
| Median | $34,550 | $40,874 |
| Interquartile 25% (IQ1) | $30,536 | $36,195 |
| Interquartile 75% (IQ3) | $37,534 | $43,538 |
| Interquartile Range (IQR) | $6,998 | $7,343 |
| Standard Deviation (Sample) | $11,827 | $7,121 |
| Standard Deviation (Population) | $11,733 | $7,066 |
Similar Demographics by Median Female Earnings
Demographics Similar to Scotch-Irish by Median Female Earnings
In terms of median female earnings, the demographic groups most similar to Scotch-Irish are Belizean ($37,429, a difference of 0.12%), Dutch ($37,339, a difference of 0.12%), Malaysian ($37,298, a difference of 0.23%), Venezuelan ($37,282, a difference of 0.27%), and Samoan ($37,498, a difference of 0.31%).
| Demographics | Rating | Rank | Median Female Earnings |
| Immigrants | Dominica | 2.0 /100 | #252 | Tragic $37,825 |
| Danes | 1.6 /100 | #253 | Tragic $37,730 |
| Whites/Caucasians | 1.1 /100 | #254 | Tragic $37,531 |
| Colville | 1.1 /100 | #255 | Tragic $37,514 |
| Samoans | 1.0 /100 | #256 | Tragic $37,498 |
| Hawaiians | 1.0 /100 | #257 | Tragic $37,497 |
| Belizeans | 0.9 /100 | #258 | Tragic $37,429 |
| Scotch-Irish | 0.8 /100 | #259 | Tragic $37,383 |
| Dutch | 0.7 /100 | #260 | Tragic $37,339 |
| Malaysians | 0.7 /100 | #261 | Tragic $37,298 |
| Venezuelans | 0.7 /100 | #262 | Tragic $37,282 |
| German Russians | 0.5 /100 | #263 | Tragic $37,105 |
| Salvadorans | 0.4 /100 | #264 | Tragic $37,083 |
| Immigrants | Belize | 0.4 /100 | #265 | Tragic $37,056 |
| Dominicans | 0.4 /100 | #266 | Tragic $37,046 |
Demographics Similar to Macedonians by Median Female Earnings
In terms of median female earnings, the demographic groups most similar to Macedonians are Immigrants from England ($41,277, a difference of 0.020%), Korean ($41,276, a difference of 0.020%), Immigrants from Brazil ($41,273, a difference of 0.030%), Barbadian ($41,261, a difference of 0.060%), and Immigrants from North America ($41,319, a difference of 0.080%).
| Demographics | Rating | Rank | Median Female Earnings |
| Immigrants | Eritrea | 97.6 /100 | #106 | Exceptional $41,485 |
| Palestinians | 97.6 /100 | #107 | Exceptional $41,484 |
| Jordanians | 97.5 /100 | #108 | Exceptional $41,464 |
| Chinese | 97.5 /100 | #109 | Exceptional $41,461 |
| Immigrants | Western Asia | 97.0 /100 | #110 | Exceptional $41,375 |
| Immigrants | Canada | 97.0 /100 | #111 | Exceptional $41,373 |
| Immigrants | North America | 96.7 /100 | #112 | Exceptional $41,319 |
| Macedonians | 96.4 /100 | #113 | Exceptional $41,286 |
| Immigrants | England | 96.4 /100 | #114 | Exceptional $41,277 |
| Koreans | 96.4 /100 | #115 | Exceptional $41,276 |
| Immigrants | Brazil | 96.4 /100 | #116 | Exceptional $41,273 |
| Barbadians | 96.3 /100 | #117 | Exceptional $41,261 |
| Immigrants | Lebanon | 95.6 /100 | #118 | Exceptional $41,183 |
| Immigrants | Philippines | 95.0 /100 | #119 | Exceptional $41,114 |
| Immigrants | Kuwait | 94.4 /100 | #120 | Exceptional $41,055 |