Scotch-Irish vs Immigrants from Lithuania Median Female Earnings
COMPARE
Scotch-Irish
Immigrants from Lithuania
Median Female Earnings
Median Female Earnings Comparison
Scotch-Irish
Immigrants from Lithuania
$37,383
MEDIAN FEMALE EARNINGS
0.8/ 100
METRIC RATING
259th/ 347
METRIC RANK
$43,317
MEDIAN FEMALE EARNINGS
99.9/ 100
METRIC RATING
52nd/ 347
METRIC RANK
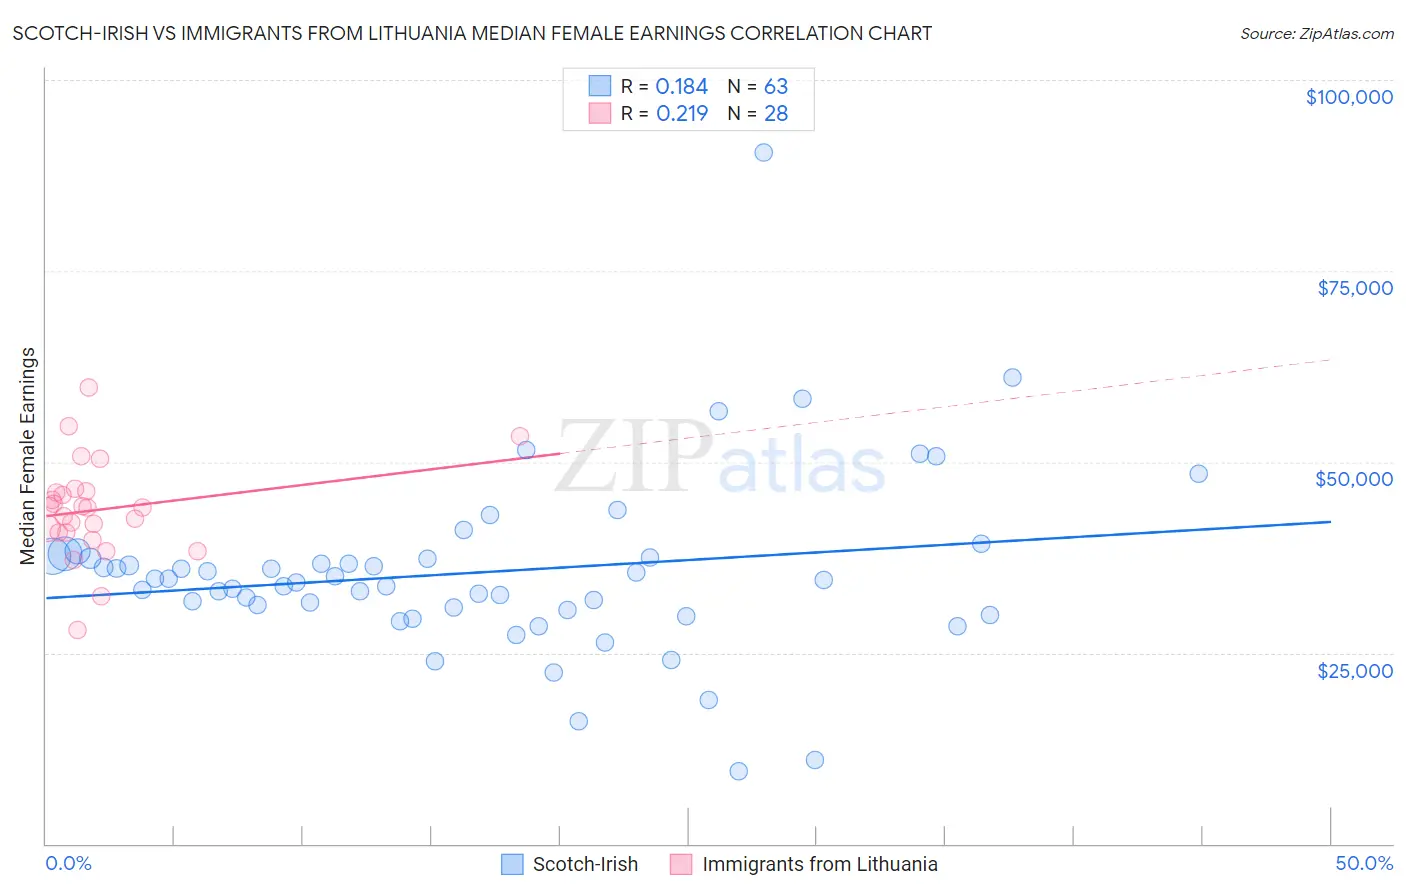
Scotch-Irish vs Immigrants from Lithuania Median Female Earnings Correlation Chart
The statistical analysis conducted on geographies consisting of 547,379,253 people shows a poor positive correlation between the proportion of Scotch-Irish and median female earnings in the United States with a correlation coefficient (R) of 0.184 and weighted average of $37,383. Similarly, the statistical analysis conducted on geographies consisting of 117,702,564 people shows a weak positive correlation between the proportion of Immigrants from Lithuania and median female earnings in the United States with a correlation coefficient (R) of 0.219 and weighted average of $43,317, a difference of 15.9%.
Median Female Earnings Correlation Summary
| Measurement | Scotch-Irish | Immigrants from Lithuania |
| Minimum | $9,426 | $27,947 |
| Maximum | $90,469 | $59,782 |
| Range | $81,043 | $31,835 |
| Mean | $35,513 | $43,754 |
| Median | $34,550 | $44,042 |
| Interquartile 25% (IQ1) | $30,536 | $40,753 |
| Interquartile 75% (IQ3) | $37,534 | $46,071 |
| Interquartile Range (IQR) | $6,998 | $5,319 |
| Standard Deviation (Sample) | $11,827 | $6,428 |
| Standard Deviation (Population) | $11,733 | $6,312 |
Similar Demographics by Median Female Earnings
Demographics Similar to Scotch-Irish by Median Female Earnings
In terms of median female earnings, the demographic groups most similar to Scotch-Irish are Belizean ($37,429, a difference of 0.12%), Dutch ($37,339, a difference of 0.12%), Malaysian ($37,298, a difference of 0.23%), Venezuelan ($37,282, a difference of 0.27%), and Samoan ($37,498, a difference of 0.31%).
| Demographics | Rating | Rank | Median Female Earnings |
| Immigrants | Dominica | 2.0 /100 | #252 | Tragic $37,825 |
| Danes | 1.6 /100 | #253 | Tragic $37,730 |
| Whites/Caucasians | 1.1 /100 | #254 | Tragic $37,531 |
| Colville | 1.1 /100 | #255 | Tragic $37,514 |
| Samoans | 1.0 /100 | #256 | Tragic $37,498 |
| Hawaiians | 1.0 /100 | #257 | Tragic $37,497 |
| Belizeans | 0.9 /100 | #258 | Tragic $37,429 |
| Scotch-Irish | 0.8 /100 | #259 | Tragic $37,383 |
| Dutch | 0.7 /100 | #260 | Tragic $37,339 |
| Malaysians | 0.7 /100 | #261 | Tragic $37,298 |
| Venezuelans | 0.7 /100 | #262 | Tragic $37,282 |
| German Russians | 0.5 /100 | #263 | Tragic $37,105 |
| Salvadorans | 0.4 /100 | #264 | Tragic $37,083 |
| Immigrants | Belize | 0.4 /100 | #265 | Tragic $37,056 |
| Dominicans | 0.4 /100 | #266 | Tragic $37,046 |
Demographics Similar to Immigrants from Lithuania by Median Female Earnings
In terms of median female earnings, the demographic groups most similar to Immigrants from Lithuania are Immigrants from Eastern Europe ($43,309, a difference of 0.020%), Australian ($43,308, a difference of 0.020%), Egyptian ($43,305, a difference of 0.030%), Maltese ($43,357, a difference of 0.090%), and Immigrants from Uzbekistan ($43,363, a difference of 0.11%).
| Demographics | Rating | Rank | Median Female Earnings |
| Immigrants | Europe | 100.0 /100 | #45 | Exceptional $43,523 |
| Immigrants | Bolivia | 100.0 /100 | #46 | Exceptional $43,467 |
| Bolivians | 100.0 /100 | #47 | Exceptional $43,445 |
| Immigrants | Indonesia | 100.0 /100 | #48 | Exceptional $43,412 |
| Immigrants | Serbia | 100.0 /100 | #49 | Exceptional $43,385 |
| Immigrants | Uzbekistan | 100.0 /100 | #50 | Exceptional $43,363 |
| Maltese | 100.0 /100 | #51 | Exceptional $43,357 |
| Immigrants | Lithuania | 99.9 /100 | #52 | Exceptional $43,317 |
| Immigrants | Eastern Europe | 99.9 /100 | #53 | Exceptional $43,309 |
| Australians | 99.9 /100 | #54 | Exceptional $43,308 |
| Egyptians | 99.9 /100 | #55 | Exceptional $43,305 |
| Immigrants | Croatia | 99.9 /100 | #56 | Exceptional $43,258 |
| Ethiopians | 99.9 /100 | #57 | Exceptional $43,243 |
| Paraguayans | 99.9 /100 | #58 | Exceptional $43,173 |
| Estonians | 99.9 /100 | #59 | Exceptional $43,106 |