Scotch-Irish vs Canadian Median Female Earnings
COMPARE
Scotch-Irish
Canadian
Median Female Earnings
Median Female Earnings Comparison
Scotch-Irish
Canadians
$37,383
MEDIAN FEMALE EARNINGS
0.8/ 100
METRIC RATING
259th/ 347
METRIC RANK
$39,724
MEDIAN FEMALE EARNINGS
51.4/ 100
METRIC RATING
173rd/ 347
METRIC RANK
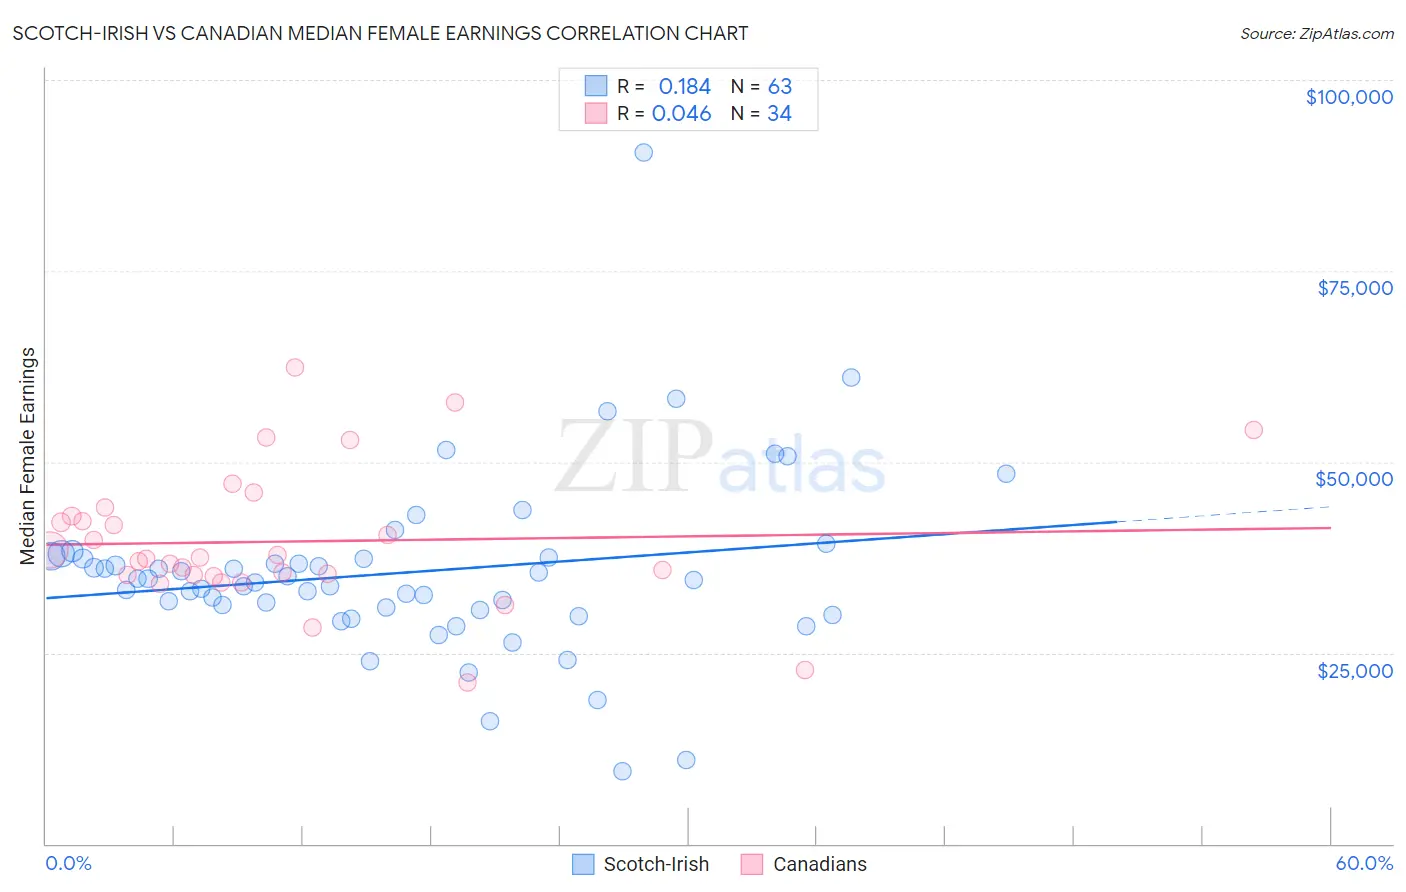
Scotch-Irish vs Canadian Median Female Earnings Correlation Chart
The statistical analysis conducted on geographies consisting of 547,379,253 people shows a poor positive correlation between the proportion of Scotch-Irish and median female earnings in the United States with a correlation coefficient (R) of 0.184 and weighted average of $37,383. Similarly, the statistical analysis conducted on geographies consisting of 437,261,658 people shows no correlation between the proportion of Canadians and median female earnings in the United States with a correlation coefficient (R) of 0.046 and weighted average of $39,724, a difference of 6.3%.
Median Female Earnings Correlation Summary
| Measurement | Scotch-Irish | Canadian |
| Minimum | $9,426 | $21,111 |
| Maximum | $90,469 | $62,276 |
| Range | $81,043 | $41,165 |
| Mean | $35,513 | $39,561 |
| Median | $34,550 | $37,391 |
| Interquartile 25% (IQ1) | $30,536 | $35,143 |
| Interquartile 75% (IQ3) | $37,534 | $42,841 |
| Interquartile Range (IQR) | $6,998 | $7,698 |
| Standard Deviation (Sample) | $11,827 | $8,927 |
| Standard Deviation (Population) | $11,733 | $8,795 |
Similar Demographics by Median Female Earnings
Demographics Similar to Scotch-Irish by Median Female Earnings
In terms of median female earnings, the demographic groups most similar to Scotch-Irish are Belizean ($37,429, a difference of 0.12%), Dutch ($37,339, a difference of 0.12%), Malaysian ($37,298, a difference of 0.23%), Venezuelan ($37,282, a difference of 0.27%), and Samoan ($37,498, a difference of 0.31%).
| Demographics | Rating | Rank | Median Female Earnings |
| Immigrants | Dominica | 2.0 /100 | #252 | Tragic $37,825 |
| Danes | 1.6 /100 | #253 | Tragic $37,730 |
| Whites/Caucasians | 1.1 /100 | #254 | Tragic $37,531 |
| Colville | 1.1 /100 | #255 | Tragic $37,514 |
| Samoans | 1.0 /100 | #256 | Tragic $37,498 |
| Hawaiians | 1.0 /100 | #257 | Tragic $37,497 |
| Belizeans | 0.9 /100 | #258 | Tragic $37,429 |
| Scotch-Irish | 0.8 /100 | #259 | Tragic $37,383 |
| Dutch | 0.7 /100 | #260 | Tragic $37,339 |
| Malaysians | 0.7 /100 | #261 | Tragic $37,298 |
| Venezuelans | 0.7 /100 | #262 | Tragic $37,282 |
| German Russians | 0.5 /100 | #263 | Tragic $37,105 |
| Salvadorans | 0.4 /100 | #264 | Tragic $37,083 |
| Immigrants | Belize | 0.4 /100 | #265 | Tragic $37,056 |
| Dominicans | 0.4 /100 | #266 | Tragic $37,046 |
Demographics Similar to Canadians by Median Female Earnings
In terms of median female earnings, the demographic groups most similar to Canadians are South American ($39,698, a difference of 0.070%), British ($39,772, a difference of 0.12%), Immigrants from Portugal ($39,788, a difference of 0.16%), Immigrants from South America ($39,643, a difference of 0.20%), and Nigerian ($39,641, a difference of 0.21%).
| Demographics | Rating | Rank | Median Female Earnings |
| Immigrants | Ghana | 60.0 /100 | #166 | Good $39,894 |
| Luxembourgers | 59.9 /100 | #167 | Average $39,891 |
| Immigrants | Peru | 58.9 /100 | #168 | Average $39,871 |
| Kenyans | 58.4 /100 | #169 | Average $39,860 |
| Slovenes | 56.2 /100 | #170 | Average $39,817 |
| Immigrants | Portugal | 54.7 /100 | #171 | Average $39,788 |
| British | 53.8 /100 | #172 | Average $39,772 |
| Canadians | 51.4 /100 | #173 | Average $39,724 |
| South Americans | 50.0 /100 | #174 | Average $39,698 |
| Immigrants | South America | 47.2 /100 | #175 | Average $39,643 |
| Nigerians | 47.0 /100 | #176 | Average $39,641 |
| Costa Ricans | 46.1 /100 | #177 | Average $39,622 |
| Slavs | 45.6 /100 | #178 | Average $39,613 |
| Immigrants | Germany | 45.1 /100 | #179 | Average $39,603 |
| Immigrants | Kenya | 41.6 /100 | #180 | Average $39,535 |