Scotch-Irish vs Immigrants from Chile Median Female Earnings

COMPARE

Scotch-Irish
Race
Ancestry
AfghanAfricanAlaska NativeAlaskan AthabascanAlbanianAleutAlsatianAmericanApacheArabArapahoArgentineanArmenianAssyrian/Chaldean/SyriacAustralianAustrianBahamianBangladeshiBarbadianBasqueBelgianBelizeanBermudanBhutaneseBlackfeetBolivianBrazilianBritishBritish West IndianBulgarianBurmeseCajunCambodianCanadianCape VerdeanCarpatho RusynCelticCentral AmericanCentral American IndianCherokeeCheyenneChickasawChileanChineseChippewaChoctawColombianColvilleComancheCosta RicanCreeCreekCroatianCrowCubanCypriotCzechCzechoslovakianDanishDelawareDominicanDutchDutch West IndianEastern EuropeanEcuadorianEgyptianEnglishEstonianEthiopianEuropeanFijianFilipinoFinnishFrenchFrench American IndianFrench CanadianGermanGerman RussianGhanaianGreekGuamanian/ChamorroGuatemalanGuyaneseHaitianHmongHonduranHopiHoumaHungarianIcelanderIndian (Asian)IndonesianInupiatIranianIraqiIrishIroquoisIsraeliItalianJamaicanJapaneseJordanianKenyanKiowaKoreanLaotianLatvianLebaneseLiberianLithuanianLumbeeLuxembourgerMacedonianMalaysianMalteseMarshalleseMenomineeMexicanMexican American IndianMongolianMoroccanNative HawaiianNavajoNepaleseNew ZealanderNicaraguanNigerianNorthern EuropeanNorwegianOkinawanOsageOttawaPaiutePakistaniPalestinianPanamanianParaguayanPennsylvania GermanPeruvianPimaPolishPortuguesePotawatomiPuebloPuerto RicanPuget Sound SalishRomanianRussianSalvadoranSamoanScandinavianScotch-IrishScottishSeminoleSenegaleseSerbianShoshoneSierra LeoneanSiouxSlavicSlovakSloveneSomaliSouth AfricanSouth AmericanSouth American IndianSoviet UnionSpaniardSpanishSpanish AmericanSpanish American IndianSri LankanSubsaharan AfricanSudaneseSwedishSwissSyrianTaiwaneseThaiTlingit-HaidaTohono O'OdhamTonganTrinidadian and TobagonianTsimshianTurkishU.S. Virgin IslanderUgandanUkrainianUruguayanUteVenezuelanVietnameseWelshWest IndianYakamaYaquiYugoslavianYumanYup'ikZimbabwean
Immigration
NonimmigrantsImmigrantsAfghanistanAfricaAlbaniaArgentinaArmeniaAsiaAustraliaAustriaBahamasBangladeshBarbadosBelarusBelgiumBelizeBoliviaBosnia and HerzegovinaBrazilBulgariaBurma/MyanmarCabo VerdeCambodiaCameroonCanadaCaribbeanCentral AmericaChinaColombiaCongoCosta RicaCroatiaCubaCzechoslovakiaDenmarkDominicaDominican RepublicEastern AfricaEastern AsiaEastern EuropeEcuadorEgyptEl SalvadorEnglandEritreaEthiopiaEuropeFijiFranceGermanyGhanaGreeceGrenadaGuatemalaGuyanaHaitiHondurasHong KongHungaryIndiaIndonesiaIranIraqIrelandIsraelItalyJamaicaJapanJordanKazakhstanKenyaKoreaKuwaitLaosLatin AmericaLatviaLebanonLiberiaLithuaniaMalaysiaMexicoMicronesiaMiddle AfricaMoldovaMoroccoNepalNetherlandsNicaraguaNigeriaNorth AmericaNorth MacedoniaNorthern AfricaNorthern EuropeNorwayOceaniaPakistanPanamaPeruPhilippinesPolandPortugalRomaniaRussiaSaudi ArabiaScotlandSenegalSerbiaSierra LeoneSingaporeSomaliaSouth AfricaSouth AmericaSouth Central AsiaSouth Eastern AsiaSouthern EuropeSpainSri LankaSt. Vincent and the GrenadinesSudanSwedenSwitzerlandSyriaTaiwanThailandTrinidad and TobagoTurkeyUgandaUkraineUruguayUzbekistanVenezuelaVietnamWest IndiesWestern AfricaWestern AsiaWestern EuropeYemenZaireZimbabweAzores
Immigrants from Chile
Race
Ancestry
AfghanAfricanAlaska NativeAlaskan AthabascanAlbanianAleutAlsatianAmericanApacheArabArapahoArgentineanArmenianAssyrian/Chaldean/SyriacAustralianAustrianBahamianBangladeshiBarbadianBasqueBelgianBelizeanBermudanBhutaneseBlackfeetBolivianBrazilianBritishBritish West IndianBulgarianBurmeseCajunCambodianCanadianCape VerdeanCarpatho RusynCelticCentral AmericanCentral American IndianCherokeeCheyenneChickasawChileanChineseChippewaChoctawColombianColvilleComancheCosta RicanCreeCreekCroatianCrowCubanCypriotCzechCzechoslovakianDanishDelawareDominicanDutchDutch West IndianEastern EuropeanEcuadorianEgyptianEnglishEstonianEthiopianEuropeanFijianFilipinoFinnishFrenchFrench American IndianFrench CanadianGermanGerman RussianGhanaianGreekGuamanian/ChamorroGuatemalanGuyaneseHaitianHmongHonduranHopiHoumaHungarianIcelanderIndian (Asian)IndonesianInupiatIranianIraqiIrishIroquoisIsraeliItalianJamaicanJapaneseJordanianKenyanKiowaKoreanLaotianLatvianLebaneseLiberianLithuanianLumbeeLuxembourgerMacedonianMalaysianMalteseMarshalleseMenomineeMexicanMexican American IndianMongolianMoroccanNative HawaiianNavajoNepaleseNew ZealanderNicaraguanNigerianNorthern EuropeanNorwegianOkinawanOsageOttawaPaiutePakistaniPalestinianPanamanianParaguayanPennsylvania GermanPeruvianPimaPolishPortuguesePotawatomiPuebloPuerto RicanPuget Sound SalishRomanianRussianSalvadoranSamoanScandinavianScottishSeminoleSenegaleseSerbianShoshoneSierra LeoneanSiouxSlavicSlovakSloveneSomaliSouth AfricanSouth AmericanSouth American IndianSoviet UnionSpaniardSpanishSpanish AmericanSpanish American IndianSri LankanSubsaharan AfricanSudaneseSwedishSwissSyrianTaiwaneseThaiTlingit-HaidaTohono O'OdhamTonganTrinidadian and TobagonianTsimshianTurkishU.S. Virgin IslanderUgandanUkrainianUruguayanUteVenezuelanVietnameseWelshWest IndianYakamaYaquiYugoslavianYumanYup'ikZimbabwean
Immigration
NonimmigrantsImmigrantsAfghanistanAfricaAlbaniaArgentinaArmeniaAsiaAustraliaAustriaBahamasBangladeshBarbadosBelarusBelgiumBelizeBoliviaBosnia and HerzegovinaBrazilBulgariaBurma/MyanmarCabo VerdeCambodiaCameroonCanadaCaribbeanCentral AmericaChileChinaColombiaCongoCosta RicaCroatiaCubaCzechoslovakiaDenmarkDominicaDominican RepublicEastern AfricaEastern AsiaEastern EuropeEcuadorEgyptEl SalvadorEnglandEritreaEthiopiaEuropeFijiFranceGermanyGhanaGreeceGrenadaGuatemalaGuyanaHaitiHondurasHong KongHungaryIndiaIndonesiaIranIraqIrelandIsraelItalyJamaicaJapanJordanKazakhstanKenyaKoreaKuwaitLaosLatin AmericaLatviaLebanonLiberiaLithuaniaMalaysiaMexicoMicronesiaMiddle AfricaMoldovaMoroccoNepalNetherlandsNicaraguaNigeriaNorth AmericaNorth MacedoniaNorthern AfricaNorthern EuropeNorwayOceaniaPakistanPanamaPeruPhilippinesPolandPortugalRomaniaRussiaSaudi ArabiaScotlandSenegalSerbiaSierra LeoneSingaporeSomaliaSouth AfricaSouth AmericaSouth Central AsiaSouth Eastern AsiaSouthern EuropeSpainSri LankaSt. Vincent and the GrenadinesSudanSwedenSwitzerlandSyriaTaiwanThailandTrinidad and TobagoTurkeyUgandaUkraineUruguayUzbekistanVenezuelaVietnamWest IndiesWestern AfricaWestern AsiaWestern EuropeYemenZaireZimbabweAzores
Median Female Earnings
Income
Poverty
Unemployment
Labor Participation
Family Structure
Vehicle Availability
Education Level
Disability

Median Female Earnings Comparison

Scotch-Irish

Immigrants from Chile

Tragic
Good
$37,383
MEDIAN FEMALE EARNINGS
0.8/ 100
METRIC RATING
259th/ 347
METRIC RANK
$40,353
MEDIAN FEMALE EARNINGS
79.6/ 100
METRIC RATING
150th/ 347
METRIC RANK

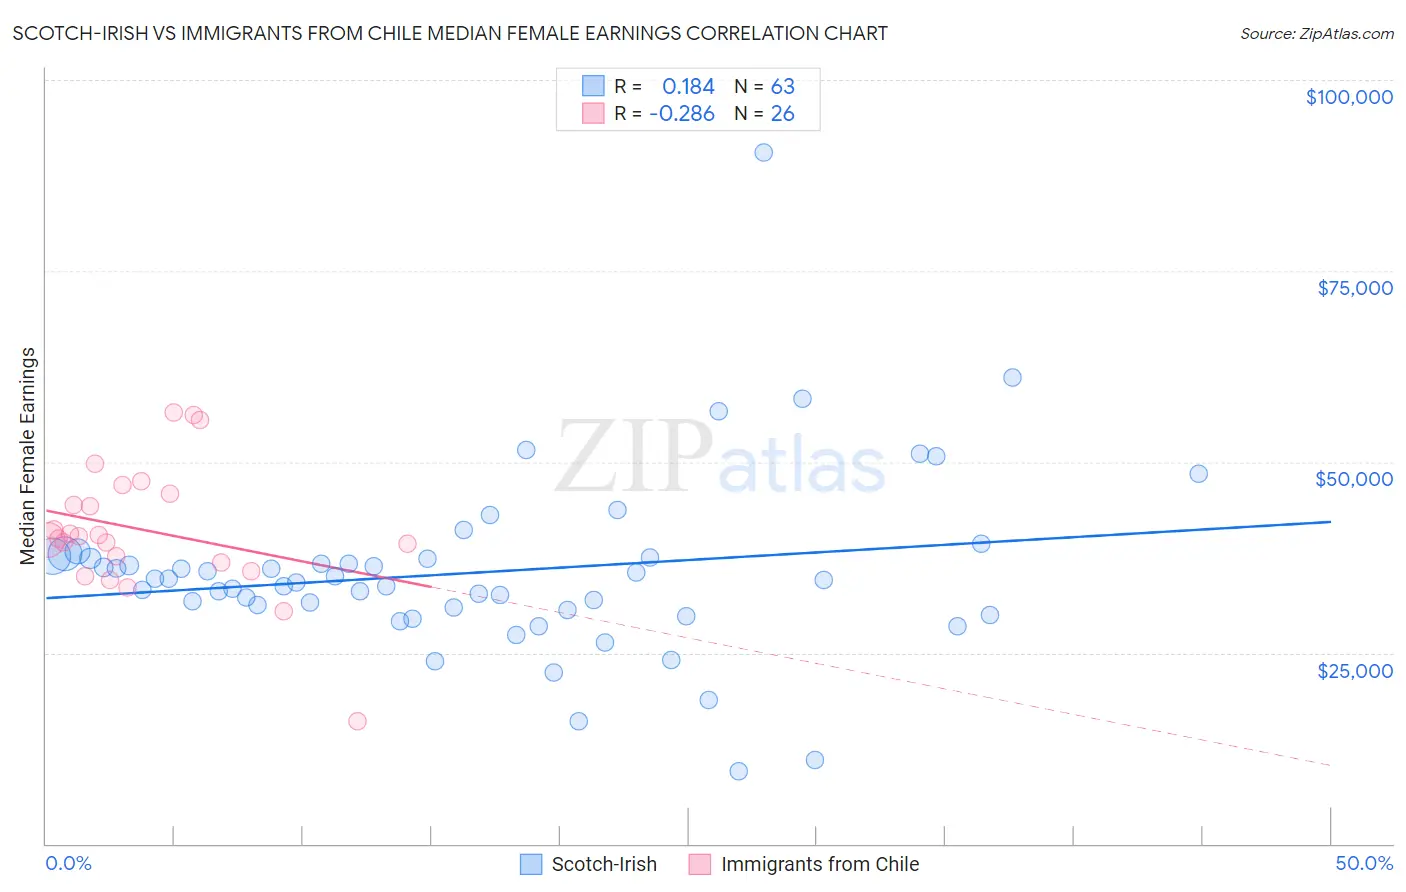
Scotch-Irish vs Immigrants from Chile Median Female Earnings Correlation Chart

The statistical analysis conducted on geographies consisting of 547,379,253 people shows a poor positive correlation between the proportion of Scotch-Irish and median female earnings in the United States with a correlation coefficient (R) of 0.184 and weighted average of $37,383. Similarly, the statistical analysis conducted on geographies consisting of 218,612,520 people shows a weak negative correlation between the proportion of Immigrants from Chile and median female earnings in the United States with a correlation coefficient (R) of -0.286 and weighted average of $40,353, a difference of 7.9%.
Scotch-Irish vs Immigrants from Chile Median Female Earnings

Median Female Earnings Correlation Summary

MeasurementScotch-IrishImmigrants from Chile
Minimum$9,426$16,042
Maximum$90,469$56,442
Range$81,043$40,400
Mean$35,513$41,031
Median$34,550$40,109
Interquartile 25% (IQ1)$30,536$36,875
Interquartile 75% (IQ3)$37,534$45,789
Interquartile Range (IQR)$6,998$8,914
Standard Deviation (Sample)$11,827$8,520
Standard Deviation (Population)$11,733$8,355

Similar Demographics by Median Female Earnings

Demographics Similar to Scotch-Irish by Median Female Earnings

In terms of median female earnings, the demographic groups most similar to Scotch-Irish are Belizean ($37,429, a difference of 0.12%), Dutch ($37,339, a difference of 0.12%), Malaysian ($37,298, a difference of 0.23%), Venezuelan ($37,282, a difference of 0.27%), and Samoan ($37,498, a difference of 0.31%).
DemographicsRating | RankMedian Female Earnings
Immigrants | Dominica
2.0
/100
|
#252
Tragic
$37,825
Danes
1.6
/100
|
#253
Tragic
$37,730
Whites/Caucasians
1.1
/100
|
#254
Tragic
$37,531
Colville
1.1
/100
|
#255
Tragic
$37,514
Samoans
1.0
/100
|
#256
Tragic
$37,498
Hawaiians
1.0
/100
|
#257
Tragic
$37,497
Belizeans
0.9
/100
|
#258
Tragic
$37,429
Scotch-Irish
0.8
/100
|
#259
Tragic
$37,383
Dutch
0.7
/100
|
#260
Tragic
$37,339
Malaysians
0.7
/100
|
#261
Tragic
$37,298
Venezuelans
0.7
/100
|
#262
Tragic
$37,282
German Russians
0.5
/100
|
#263
Tragic
$37,105
Salvadorans
0.4
/100
|
#264
Tragic
$37,083
Immigrants | Belize
0.4
/100
|
#265
Tragic
$37,056
Dominicans
0.4
/100
|
#266
Tragic
$37,046

Demographics Similar to Immigrants from Chile by Median Female Earnings

In terms of median female earnings, the demographic groups most similar to Immigrants from Chile are Immigrants from Cameroon ($40,354, a difference of 0.0%), Immigrants from Armenia ($40,340, a difference of 0.030%), Polish ($40,371, a difference of 0.040%), Vietnamese ($40,377, a difference of 0.060%), and West Indian ($40,317, a difference of 0.090%).
DemographicsRating | RankMedian Female Earnings
Northern Europeans
83.9
/100
|
#143
Excellent
$40,491
Immigrants | North Macedonia
83.8
/100
|
#144
Excellent
$40,488
Brazilians
83.6
/100
|
#145
Excellent
$40,483
Ghanaians
82.1
/100
|
#146
Excellent
$40,429
Vietnamese
80.4
/100
|
#147
Excellent
$40,377
Poles
80.2
/100
|
#148
Excellent
$40,371
Immigrants | Cameroon
79.7
/100
|
#149
Good
$40,354
Immigrants | Chile
79.6
/100
|
#150
Good
$40,353
Immigrants | Armenia
79.2
/100
|
#151
Good
$40,340
West Indians
78.4
/100
|
#152
Good
$40,317
British West Indians
77.7
/100
|
#153
Good
$40,299
Immigrants | Oceania
77.6
/100
|
#154
Good
$40,297
Immigrants | Africa
76.2
/100
|
#155
Good
$40,257
Peruvians
75.3
/100
|
#156
Good
$40,234
Portuguese
73.0
/100
|
#157
Good
$40,177