Immigrants from Afghanistan vs Afghan Median Female Earnings
COMPARE
Immigrants from Afghanistan
Afghan
Median Female Earnings
Median Female Earnings Comparison
Immigrants from Afghanistan
Afghans
$42,055
MEDIAN FEMALE EARNINGS
99.3/ 100
METRIC RATING
89th/ 347
METRIC RANK
$43,077
MEDIAN FEMALE EARNINGS
99.9/ 100
METRIC RATING
62nd/ 347
METRIC RANK
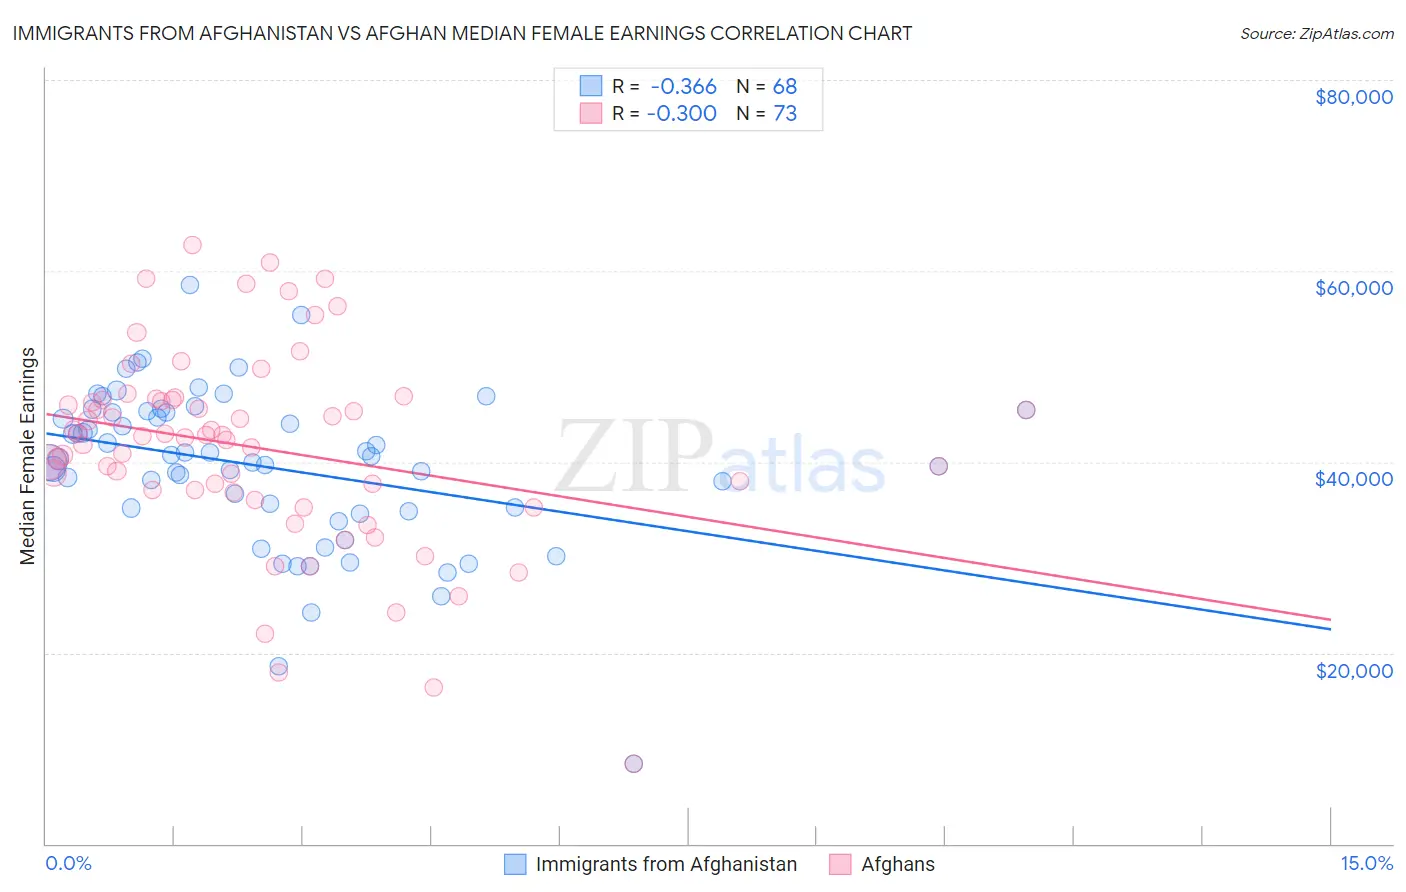
Immigrants from Afghanistan vs Afghan Median Female Earnings Correlation Chart
The statistical analysis conducted on geographies consisting of 147,640,622 people shows a mild negative correlation between the proportion of Immigrants from Afghanistan and median female earnings in the United States with a correlation coefficient (R) of -0.366 and weighted average of $42,055. Similarly, the statistical analysis conducted on geographies consisting of 148,870,057 people shows a mild negative correlation between the proportion of Afghans and median female earnings in the United States with a correlation coefficient (R) of -0.300 and weighted average of $43,077, a difference of 2.4%.
Median Female Earnings Correlation Summary
| Measurement | Immigrants from Afghanistan | Afghan |
| Minimum | $8,380 | $8,380 |
| Maximum | $58,562 | $62,780 |
| Range | $50,182 | $54,400 |
| Mean | $39,466 | $41,426 |
| Median | $40,414 | $42,748 |
| Interquartile 25% (IQ1) | $34,989 | $36,907 |
| Interquartile 75% (IQ3) | $45,239 | $46,506 |
| Interquartile Range (IQR) | $10,250 | $9,599 |
| Standard Deviation (Sample) | $8,425 | $10,289 |
| Standard Deviation (Population) | $8,363 | $10,218 |
Similar Demographics by Median Female Earnings
Demographics Similar to Immigrants from Afghanistan by Median Female Earnings
In terms of median female earnings, the demographic groups most similar to Immigrants from Afghanistan are Immigrants from Northern Africa ($42,084, a difference of 0.070%), Ukrainian ($42,015, a difference of 0.10%), Lithuanian ($42,108, a difference of 0.12%), Immigrants from St. Vincent and the Grenadines ($42,108, a difference of 0.13%), and Immigrants from Western Europe ($41,990, a difference of 0.15%).
| Demographics | Rating | Rank | Median Female Earnings |
| Immigrants | Morocco | 99.5 /100 | #82 | Exceptional $42,229 |
| Immigrants | Sierra Leone | 99.5 /100 | #83 | Exceptional $42,214 |
| Armenians | 99.5 /100 | #84 | Exceptional $42,212 |
| Laotians | 99.4 /100 | #85 | Exceptional $42,133 |
| Immigrants | St. Vincent and the Grenadines | 99.3 /100 | #86 | Exceptional $42,108 |
| Lithuanians | 99.3 /100 | #87 | Exceptional $42,108 |
| Immigrants | Northern Africa | 99.3 /100 | #88 | Exceptional $42,084 |
| Immigrants | Afghanistan | 99.3 /100 | #89 | Exceptional $42,055 |
| Ukrainians | 99.2 /100 | #90 | Exceptional $42,015 |
| Immigrants | Western Europe | 99.2 /100 | #91 | Exceptional $41,990 |
| Argentineans | 99.1 /100 | #92 | Exceptional $41,952 |
| Immigrants | Grenada | 99.0 /100 | #93 | Exceptional $41,932 |
| Moroccans | 98.9 /100 | #94 | Exceptional $41,872 |
| Immigrants | Netherlands | 98.9 /100 | #95 | Exceptional $41,870 |
| South Africans | 98.8 /100 | #96 | Exceptional $41,825 |
Demographics Similar to Afghans by Median Female Earnings
In terms of median female earnings, the demographic groups most similar to Afghans are Immigrants from Bulgaria ($43,085, a difference of 0.020%), Immigrants from Ukraine ($43,069, a difference of 0.020%), Immigrants from Latvia ($43,099, a difference of 0.050%), Immigrants from Pakistan ($43,052, a difference of 0.060%), and Estonian ($43,106, a difference of 0.070%).
| Demographics | Rating | Rank | Median Female Earnings |
| Egyptians | 99.9 /100 | #55 | Exceptional $43,305 |
| Immigrants | Croatia | 99.9 /100 | #56 | Exceptional $43,258 |
| Ethiopians | 99.9 /100 | #57 | Exceptional $43,243 |
| Paraguayans | 99.9 /100 | #58 | Exceptional $43,173 |
| Estonians | 99.9 /100 | #59 | Exceptional $43,106 |
| Immigrants | Latvia | 99.9 /100 | #60 | Exceptional $43,099 |
| Immigrants | Bulgaria | 99.9 /100 | #61 | Exceptional $43,085 |
| Afghans | 99.9 /100 | #62 | Exceptional $43,077 |
| Immigrants | Ukraine | 99.9 /100 | #63 | Exceptional $43,069 |
| Immigrants | Pakistan | 99.9 /100 | #64 | Exceptional $43,052 |
| Sierra Leoneans | 99.9 /100 | #65 | Exceptional $42,868 |
| Immigrants | Norway | 99.9 /100 | #66 | Exceptional $42,837 |
| Immigrants | Egypt | 99.9 /100 | #67 | Exceptional $42,837 |
| Immigrants | Austria | 99.8 /100 | #68 | Exceptional $42,824 |
| Immigrants | Spain | 99.8 /100 | #69 | Exceptional $42,815 |