Scandinavian vs Immigrants from Serbia Median Male Earnings
COMPARE
Scandinavian
Immigrants from Serbia
Median Male Earnings
Median Male Earnings Comparison
Scandinavians
Immigrants from Serbia
$55,527
MEDIAN MALE EARNINGS
73.4/ 100
METRIC RATING
155th/ 347
METRIC RANK
$60,600
MEDIAN MALE EARNINGS
99.7/ 100
METRIC RATING
68th/ 347
METRIC RANK
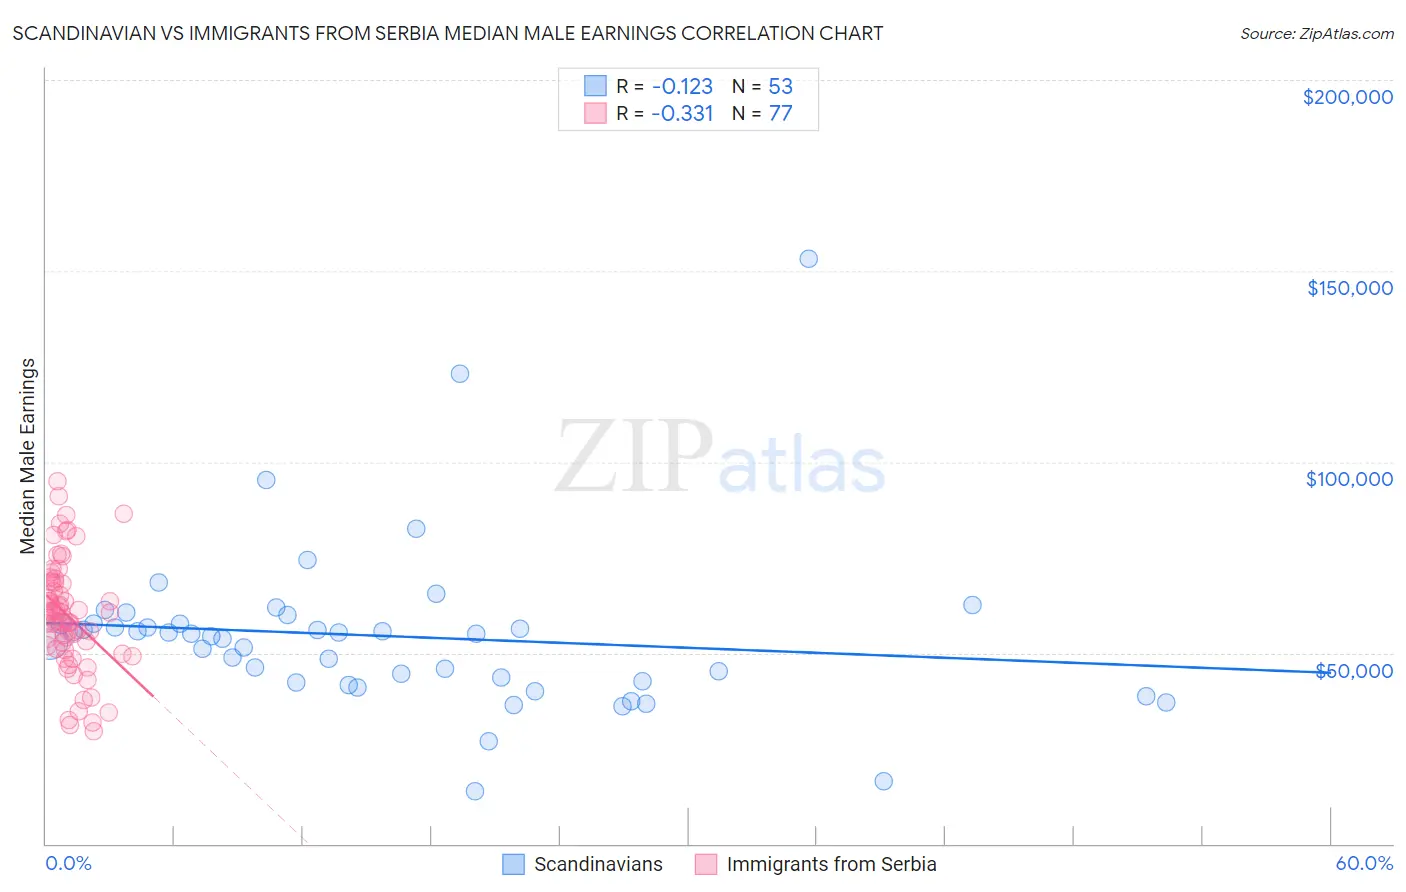
Scandinavian vs Immigrants from Serbia Median Male Earnings Correlation Chart
The statistical analysis conducted on geographies consisting of 472,245,233 people shows a poor negative correlation between the proportion of Scandinavians and median male earnings in the United States with a correlation coefficient (R) of -0.123 and weighted average of $55,527. Similarly, the statistical analysis conducted on geographies consisting of 131,723,940 people shows a mild negative correlation between the proportion of Immigrants from Serbia and median male earnings in the United States with a correlation coefficient (R) of -0.331 and weighted average of $60,600, a difference of 9.1%.
Median Male Earnings Correlation Summary
| Measurement | Scandinavian | Immigrants from Serbia |
| Minimum | $13,865 | $29,375 |
| Maximum | $153,203 | $94,985 |
| Range | $139,338 | $65,610 |
| Mean | $54,403 | $59,777 |
| Median | $55,045 | $59,576 |
| Interquartile 25% (IQ1) | $42,380 | $51,444 |
| Interquartile 75% (IQ3) | $57,674 | $68,411 |
| Interquartile Range (IQR) | $15,293 | $16,967 |
| Standard Deviation (Sample) | $21,926 | $14,261 |
| Standard Deviation (Population) | $21,718 | $14,168 |
Similar Demographics by Median Male Earnings
Demographics Similar to Scandinavians by Median Male Earnings
In terms of median male earnings, the demographic groups most similar to Scandinavians are Taiwanese ($55,556, a difference of 0.050%), Immigrants from Nepal ($55,615, a difference of 0.16%), Immigrants from Ethiopia ($55,434, a difference of 0.17%), Icelander ($55,415, a difference of 0.20%), and Peruvian ($55,659, a difference of 0.24%).
| Demographics | Rating | Rank | Median Male Earnings |
| Scottish | 78.2 /100 | #148 | Good $55,793 |
| English | 77.4 /100 | #149 | Good $55,747 |
| Swiss | 77.1 /100 | #150 | Good $55,731 |
| Immigrants | Oceania | 76.8 /100 | #151 | Good $55,712 |
| Peruvians | 75.8 /100 | #152 | Good $55,659 |
| Immigrants | Nepal | 75.0 /100 | #153 | Good $55,615 |
| Taiwanese | 73.9 /100 | #154 | Good $55,556 |
| Scandinavians | 73.4 /100 | #155 | Good $55,527 |
| Immigrants | Ethiopia | 71.6 /100 | #156 | Good $55,434 |
| Icelanders | 71.2 /100 | #157 | Good $55,415 |
| Czechoslovakians | 70.5 /100 | #158 | Good $55,382 |
| Alsatians | 70.5 /100 | #159 | Good $55,380 |
| Basques | 70.3 /100 | #160 | Good $55,370 |
| Belgians | 70.1 /100 | #161 | Good $55,361 |
| French | 69.9 /100 | #162 | Good $55,350 |
Demographics Similar to Immigrants from Serbia by Median Male Earnings
In terms of median male earnings, the demographic groups most similar to Immigrants from Serbia are Immigrants from Spain ($60,750, a difference of 0.25%), Immigrants from Canada ($60,388, a difference of 0.35%), Immigrants from Bulgaria ($60,358, a difference of 0.40%), Mongolian ($60,350, a difference of 0.41%), and Immigrants from Western Europe ($60,334, a difference of 0.44%).
| Demographics | Rating | Rank | Median Male Earnings |
| Bolivians | 99.8 /100 | #61 | Exceptional $61,066 |
| Immigrants | Romania | 99.8 /100 | #62 | Exceptional $61,040 |
| Immigrants | Pakistan | 99.8 /100 | #63 | Exceptional $60,987 |
| Immigrants | Eastern Europe | 99.8 /100 | #64 | Exceptional $60,958 |
| Immigrants | Indonesia | 99.8 /100 | #65 | Exceptional $60,935 |
| Immigrants | Croatia | 99.8 /100 | #66 | Exceptional $60,914 |
| Immigrants | Spain | 99.8 /100 | #67 | Exceptional $60,750 |
| Immigrants | Serbia | 99.7 /100 | #68 | Exceptional $60,600 |
| Immigrants | Canada | 99.7 /100 | #69 | Exceptional $60,388 |
| Immigrants | Bulgaria | 99.7 /100 | #70 | Exceptional $60,358 |
| Mongolians | 99.7 /100 | #71 | Exceptional $60,350 |
| Immigrants | Western Europe | 99.7 /100 | #72 | Exceptional $60,334 |
| Immigrants | North America | 99.7 /100 | #73 | Exceptional $60,265 |
| Argentineans | 99.6 /100 | #74 | Exceptional $60,117 |
| Immigrants | Bolivia | 99.6 /100 | #75 | Exceptional $60,088 |