Scandinavian vs Potawatomi Median Male Earnings
COMPARE
Scandinavian
Potawatomi
Median Male Earnings
Median Male Earnings Comparison
Scandinavians
Potawatomi
$55,527
MEDIAN MALE EARNINGS
73.4/ 100
METRIC RATING
155th/ 347
METRIC RANK
$48,768
MEDIAN MALE EARNINGS
0.4/ 100
METRIC RATING
270th/ 347
METRIC RANK
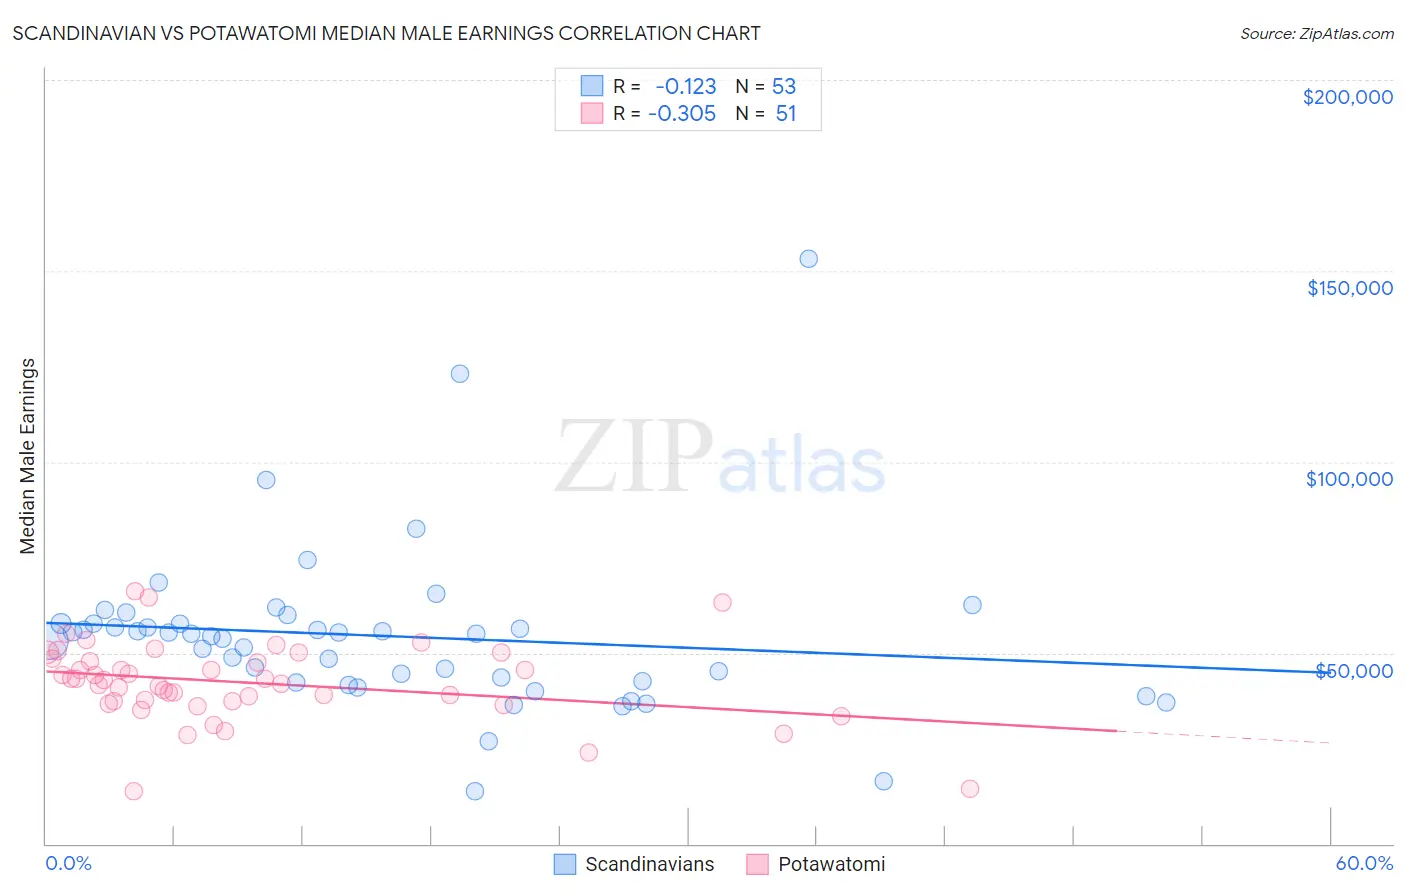
Scandinavian vs Potawatomi Median Male Earnings Correlation Chart
The statistical analysis conducted on geographies consisting of 472,245,233 people shows a poor negative correlation between the proportion of Scandinavians and median male earnings in the United States with a correlation coefficient (R) of -0.123 and weighted average of $55,527. Similarly, the statistical analysis conducted on geographies consisting of 117,758,062 people shows a mild negative correlation between the proportion of Potawatomi and median male earnings in the United States with a correlation coefficient (R) of -0.305 and weighted average of $48,768, a difference of 13.9%.
Median Male Earnings Correlation Summary
| Measurement | Scandinavian | Potawatomi |
| Minimum | $13,865 | $13,889 |
| Maximum | $153,203 | $66,032 |
| Range | $139,338 | $52,143 |
| Mean | $54,403 | $42,177 |
| Median | $55,045 | $42,915 |
| Interquartile 25% (IQ1) | $42,380 | $37,274 |
| Interquartile 75% (IQ3) | $57,674 | $48,416 |
| Interquartile Range (IQR) | $15,293 | $11,141 |
| Standard Deviation (Sample) | $21,926 | $10,408 |
| Standard Deviation (Population) | $21,718 | $10,305 |
Similar Demographics by Median Male Earnings
Demographics Similar to Scandinavians by Median Male Earnings
In terms of median male earnings, the demographic groups most similar to Scandinavians are Taiwanese ($55,556, a difference of 0.050%), Immigrants from Nepal ($55,615, a difference of 0.16%), Immigrants from Ethiopia ($55,434, a difference of 0.17%), Icelander ($55,415, a difference of 0.20%), and Peruvian ($55,659, a difference of 0.24%).
| Demographics | Rating | Rank | Median Male Earnings |
| Scottish | 78.2 /100 | #148 | Good $55,793 |
| English | 77.4 /100 | #149 | Good $55,747 |
| Swiss | 77.1 /100 | #150 | Good $55,731 |
| Immigrants | Oceania | 76.8 /100 | #151 | Good $55,712 |
| Peruvians | 75.8 /100 | #152 | Good $55,659 |
| Immigrants | Nepal | 75.0 /100 | #153 | Good $55,615 |
| Taiwanese | 73.9 /100 | #154 | Good $55,556 |
| Scandinavians | 73.4 /100 | #155 | Good $55,527 |
| Immigrants | Ethiopia | 71.6 /100 | #156 | Good $55,434 |
| Icelanders | 71.2 /100 | #157 | Good $55,415 |
| Czechoslovakians | 70.5 /100 | #158 | Good $55,382 |
| Alsatians | 70.5 /100 | #159 | Good $55,380 |
| Basques | 70.3 /100 | #160 | Good $55,370 |
| Belgians | 70.1 /100 | #161 | Good $55,361 |
| French | 69.9 /100 | #162 | Good $55,350 |
Demographics Similar to Potawatomi by Median Male Earnings
In terms of median male earnings, the demographic groups most similar to Potawatomi are Tsimshian ($48,836, a difference of 0.14%), Cherokee ($48,669, a difference of 0.20%), Salvadoran ($48,646, a difference of 0.25%), Ute ($48,899, a difference of 0.27%), and Jamaican ($48,632, a difference of 0.28%).
| Demographics | Rating | Rank | Median Male Earnings |
| Nicaraguans | 0.6 /100 | #263 | Tragic $49,215 |
| Immigrants | Middle Africa | 0.6 /100 | #264 | Tragic $49,201 |
| Immigrants | Laos | 0.6 /100 | #265 | Tragic $49,190 |
| Somalis | 0.5 /100 | #266 | Tragic $49,025 |
| Spanish Americans | 0.5 /100 | #267 | Tragic $49,008 |
| Ute | 0.4 /100 | #268 | Tragic $48,899 |
| Tsimshian | 0.4 /100 | #269 | Tragic $48,836 |
| Potawatomi | 0.4 /100 | #270 | Tragic $48,768 |
| Cherokee | 0.3 /100 | #271 | Tragic $48,669 |
| Salvadorans | 0.3 /100 | #272 | Tragic $48,646 |
| Jamaicans | 0.3 /100 | #273 | Tragic $48,632 |
| Colville | 0.3 /100 | #274 | Tragic $48,516 |
| Immigrants | Somalia | 0.3 /100 | #275 | Tragic $48,439 |
| Blackfeet | 0.3 /100 | #276 | Tragic $48,402 |
| Belizeans | 0.2 /100 | #277 | Tragic $48,358 |