Scandinavian vs Immigrants from Colombia Unemployment
COMPARE
Scandinavian
Immigrants from Colombia
Unemployment
Unemployment Comparison
Scandinavians
Immigrants from Colombia
4.5%
UNEMPLOYMENT
100.0/ 100
METRIC RATING
9th/ 347
METRIC RANK
5.2%
UNEMPLOYMENT
64.7/ 100
METRIC RATING
164th/ 347
METRIC RANK
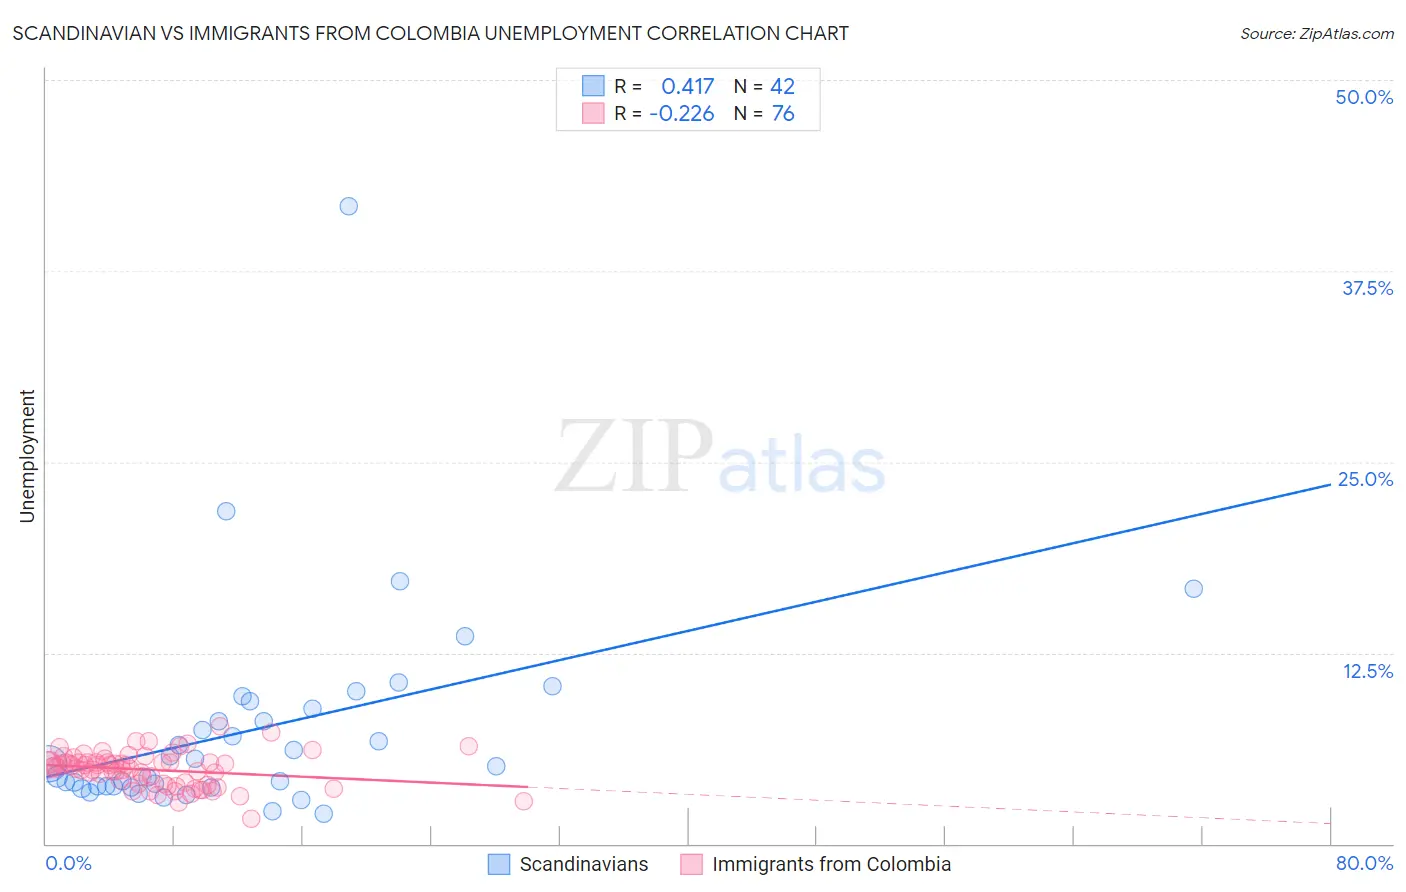
Scandinavian vs Immigrants from Colombia Unemployment Correlation Chart
The statistical analysis conducted on geographies consisting of 471,134,185 people shows a moderate positive correlation between the proportion of Scandinavians and unemployment in the United States with a correlation coefficient (R) of 0.417 and weighted average of 4.5%. Similarly, the statistical analysis conducted on geographies consisting of 378,436,728 people shows a weak negative correlation between the proportion of Immigrants from Colombia and unemployment in the United States with a correlation coefficient (R) of -0.226 and weighted average of 5.2%, a difference of 14.5%.
Unemployment Correlation Summary
| Measurement | Scandinavian | Immigrants from Colombia |
| Minimum | 2.0% | 1.6% |
| Maximum | 41.7% | 7.7% |
| Range | 39.7% | 6.1% |
| Mean | 7.4% | 4.8% |
| Median | 5.2% | 5.0% |
| Interquartile 25% (IQ1) | 3.7% | 3.9% |
| Interquartile 75% (IQ3) | 8.8% | 5.3% |
| Interquartile Range (IQR) | 5.1% | 1.4% |
| Standard Deviation (Sample) | 6.9% | 1.1% |
| Standard Deviation (Population) | 6.8% | 1.1% |
Similar Demographics by Unemployment
Demographics Similar to Scandinavians by Unemployment
In terms of unemployment, the demographic groups most similar to Scandinavians are Swiss (4.5%, a difference of 0.39%), Dutch (4.6%, a difference of 0.51%), Immigrants from India (4.5%, a difference of 0.86%), English (4.6%, a difference of 1.2%), and Pennsylvania German (4.6%, a difference of 1.3%).
| Demographics | Rating | Rank | Unemployment |
| Luxembourgers | 100.0 /100 | #2 | Exceptional 4.3% |
| Czechs | 100.0 /100 | #3 | Exceptional 4.3% |
| Danes | 100.0 /100 | #4 | Exceptional 4.3% |
| Swedes | 100.0 /100 | #5 | Exceptional 4.4% |
| Germans | 100.0 /100 | #6 | Exceptional 4.5% |
| Immigrants | India | 100.0 /100 | #7 | Exceptional 4.5% |
| Swiss | 100.0 /100 | #8 | Exceptional 4.5% |
| Scandinavians | 100.0 /100 | #9 | Exceptional 4.5% |
| Dutch | 100.0 /100 | #10 | Exceptional 4.6% |
| English | 100.0 /100 | #11 | Exceptional 4.6% |
| Pennsylvania Germans | 100.0 /100 | #12 | Exceptional 4.6% |
| Belgians | 100.0 /100 | #13 | Exceptional 4.6% |
| Immigrants | Cuba | 100.0 /100 | #14 | Exceptional 4.6% |
| Europeans | 99.9 /100 | #15 | Exceptional 4.6% |
| Chinese | 99.9 /100 | #16 | Exceptional 4.7% |
Demographics Similar to Immigrants from Colombia by Unemployment
In terms of unemployment, the demographic groups most similar to Immigrants from Colombia are Immigrants from Zaire (5.2%, a difference of 0.0%), Spanish (5.2%, a difference of 0.030%), Immigrants from Oceania (5.2%, a difference of 0.040%), Laotian (5.2%, a difference of 0.11%), and Immigrants from Brazil (5.2%, a difference of 0.11%).
| Demographics | Rating | Rank | Unemployment |
| Sri Lankans | 69.5 /100 | #157 | Good 5.2% |
| Immigrants | Egypt | 66.7 /100 | #158 | Good 5.2% |
| Immigrants | Russia | 66.6 /100 | #159 | Good 5.2% |
| Laotians | 66.3 /100 | #160 | Good 5.2% |
| Immigrants | Oceania | 65.2 /100 | #161 | Good 5.2% |
| Spanish | 65.1 /100 | #162 | Good 5.2% |
| Immigrants | Zaire | 64.7 /100 | #163 | Good 5.2% |
| Immigrants | Colombia | 64.7 /100 | #164 | Good 5.2% |
| Immigrants | Brazil | 63.1 /100 | #165 | Good 5.2% |
| Immigrants | Indonesia | 61.2 /100 | #166 | Good 5.2% |
| Colombians | 61.1 /100 | #167 | Good 5.2% |
| Uruguayans | 60.2 /100 | #168 | Good 5.2% |
| Immigrants | Morocco | 59.1 /100 | #169 | Average 5.2% |
| Immigrants | Nicaragua | 57.1 /100 | #170 | Average 5.2% |
| Puget Sound Salish | 56.6 /100 | #171 | Average 5.2% |