Scandinavian vs Aleut Median Male Earnings
COMPARE
Scandinavian
Aleut
Median Male Earnings
Median Male Earnings Comparison
Scandinavians
Aleuts
$55,527
MEDIAN MALE EARNINGS
73.4/ 100
METRIC RATING
155th/ 347
METRIC RANK
$51,168
MEDIAN MALE EARNINGS
3.7/ 100
METRIC RATING
233rd/ 347
METRIC RANK
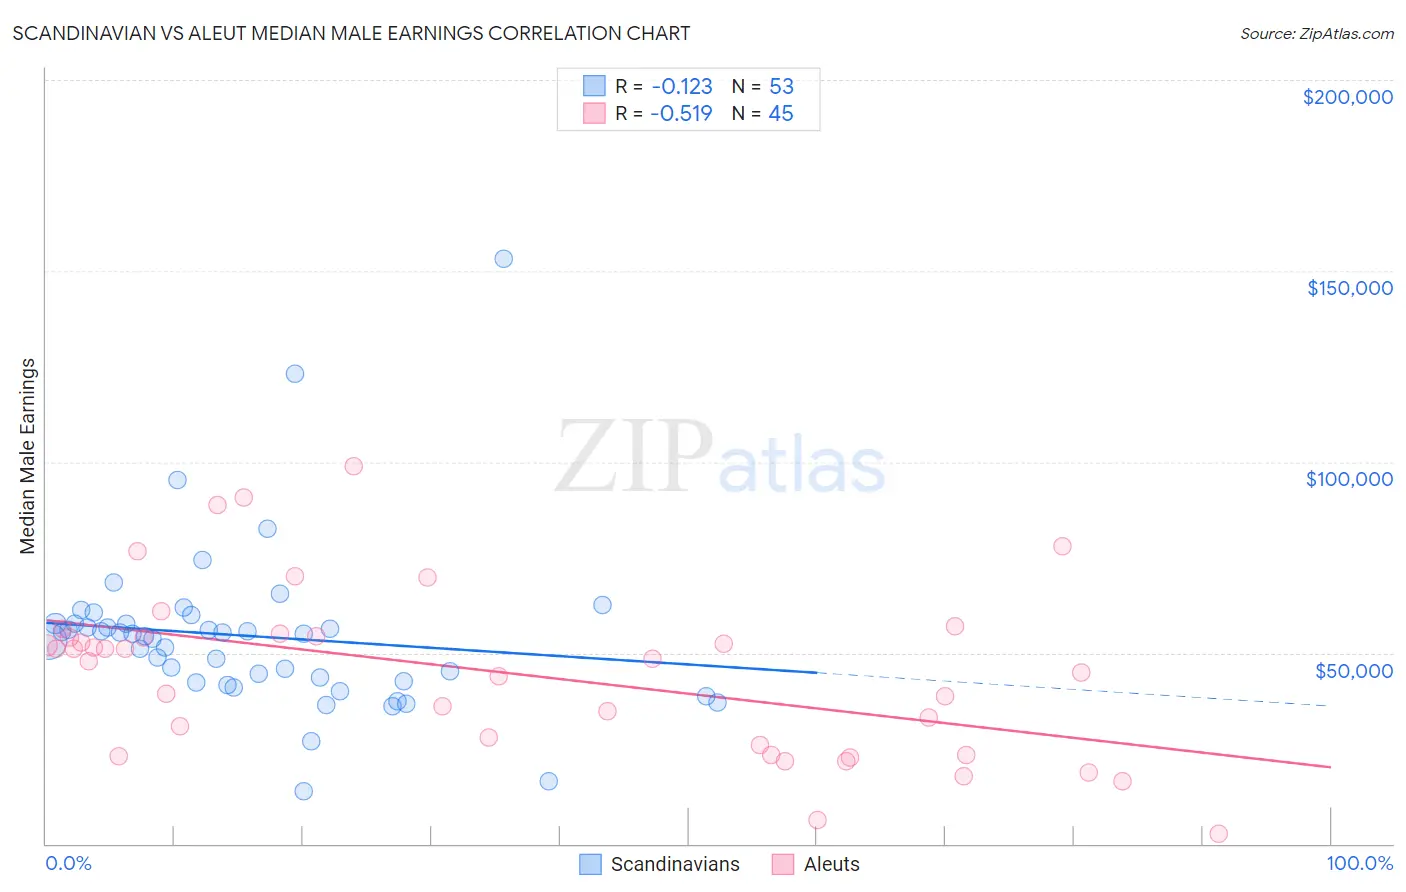
Scandinavian vs Aleut Median Male Earnings Correlation Chart
The statistical analysis conducted on geographies consisting of 472,245,233 people shows a poor negative correlation between the proportion of Scandinavians and median male earnings in the United States with a correlation coefficient (R) of -0.123 and weighted average of $55,527. Similarly, the statistical analysis conducted on geographies consisting of 61,765,699 people shows a substantial negative correlation between the proportion of Aleuts and median male earnings in the United States with a correlation coefficient (R) of -0.519 and weighted average of $51,168, a difference of 8.5%.
Median Male Earnings Correlation Summary
| Measurement | Scandinavian | Aleut |
| Minimum | $13,865 | $2,499 |
| Maximum | $153,203 | $98,906 |
| Range | $139,338 | $96,407 |
| Mean | $54,403 | $44,984 |
| Median | $55,045 | $48,500 |
| Interquartile 25% (IQ1) | $42,380 | $24,583 |
| Interquartile 75% (IQ3) | $57,674 | $54,582 |
| Interquartile Range (IQR) | $15,293 | $29,999 |
| Standard Deviation (Sample) | $21,926 | $22,008 |
| Standard Deviation (Population) | $21,718 | $21,762 |
Similar Demographics by Median Male Earnings
Demographics Similar to Scandinavians by Median Male Earnings
In terms of median male earnings, the demographic groups most similar to Scandinavians are Taiwanese ($55,556, a difference of 0.050%), Immigrants from Nepal ($55,615, a difference of 0.16%), Immigrants from Ethiopia ($55,434, a difference of 0.17%), Icelander ($55,415, a difference of 0.20%), and Peruvian ($55,659, a difference of 0.24%).
| Demographics | Rating | Rank | Median Male Earnings |
| Scottish | 78.2 /100 | #148 | Good $55,793 |
| English | 77.4 /100 | #149 | Good $55,747 |
| Swiss | 77.1 /100 | #150 | Good $55,731 |
| Immigrants | Oceania | 76.8 /100 | #151 | Good $55,712 |
| Peruvians | 75.8 /100 | #152 | Good $55,659 |
| Immigrants | Nepal | 75.0 /100 | #153 | Good $55,615 |
| Taiwanese | 73.9 /100 | #154 | Good $55,556 |
| Scandinavians | 73.4 /100 | #155 | Good $55,527 |
| Immigrants | Ethiopia | 71.6 /100 | #156 | Good $55,434 |
| Icelanders | 71.2 /100 | #157 | Good $55,415 |
| Czechoslovakians | 70.5 /100 | #158 | Good $55,382 |
| Alsatians | 70.5 /100 | #159 | Good $55,380 |
| Basques | 70.3 /100 | #160 | Good $55,370 |
| Belgians | 70.1 /100 | #161 | Good $55,361 |
| French | 69.9 /100 | #162 | Good $55,350 |
Demographics Similar to Aleuts by Median Male Earnings
In terms of median male earnings, the demographic groups most similar to Aleuts are Sudanese ($51,216, a difference of 0.090%), Barbadian ($51,236, a difference of 0.13%), Cape Verdean ($51,103, a difference of 0.13%), Immigrants from Nigeria ($51,310, a difference of 0.28%), and Immigrants from Trinidad and Tobago ($51,376, a difference of 0.41%).
| Demographics | Rating | Rank | Median Male Earnings |
| Japanese | 4.9 /100 | #226 | Tragic $51,473 |
| Trinidadians and Tobagonians | 4.8 /100 | #227 | Tragic $51,446 |
| Samoans | 4.6 /100 | #228 | Tragic $51,389 |
| Immigrants | Trinidad and Tobago | 4.5 /100 | #229 | Tragic $51,376 |
| Immigrants | Nigeria | 4.2 /100 | #230 | Tragic $51,310 |
| Barbadians | 3.9 /100 | #231 | Tragic $51,236 |
| Sudanese | 3.9 /100 | #232 | Tragic $51,216 |
| Aleuts | 3.7 /100 | #233 | Tragic $51,168 |
| Cape Verdeans | 3.5 /100 | #234 | Tragic $51,103 |
| Immigrants | Western Africa | 3.0 /100 | #235 | Tragic $50,940 |
| Pennsylvania Germans | 2.8 /100 | #236 | Tragic $50,878 |
| Immigrants | Barbados | 2.6 /100 | #237 | Tragic $50,795 |
| Malaysians | 2.5 /100 | #238 | Tragic $50,772 |
| Americans | 2.5 /100 | #239 | Tragic $50,761 |
| West Indians | 2.3 /100 | #240 | Tragic $50,682 |