Scandinavian vs Shoshone Median Male Earnings
COMPARE
Scandinavian
Shoshone
Median Male Earnings
Median Male Earnings Comparison
Scandinavians
Shoshone
$55,527
MEDIAN MALE EARNINGS
73.4/ 100
METRIC RATING
155th/ 347
METRIC RANK
$47,930
MEDIAN MALE EARNINGS
0.2/ 100
METRIC RATING
288th/ 347
METRIC RANK
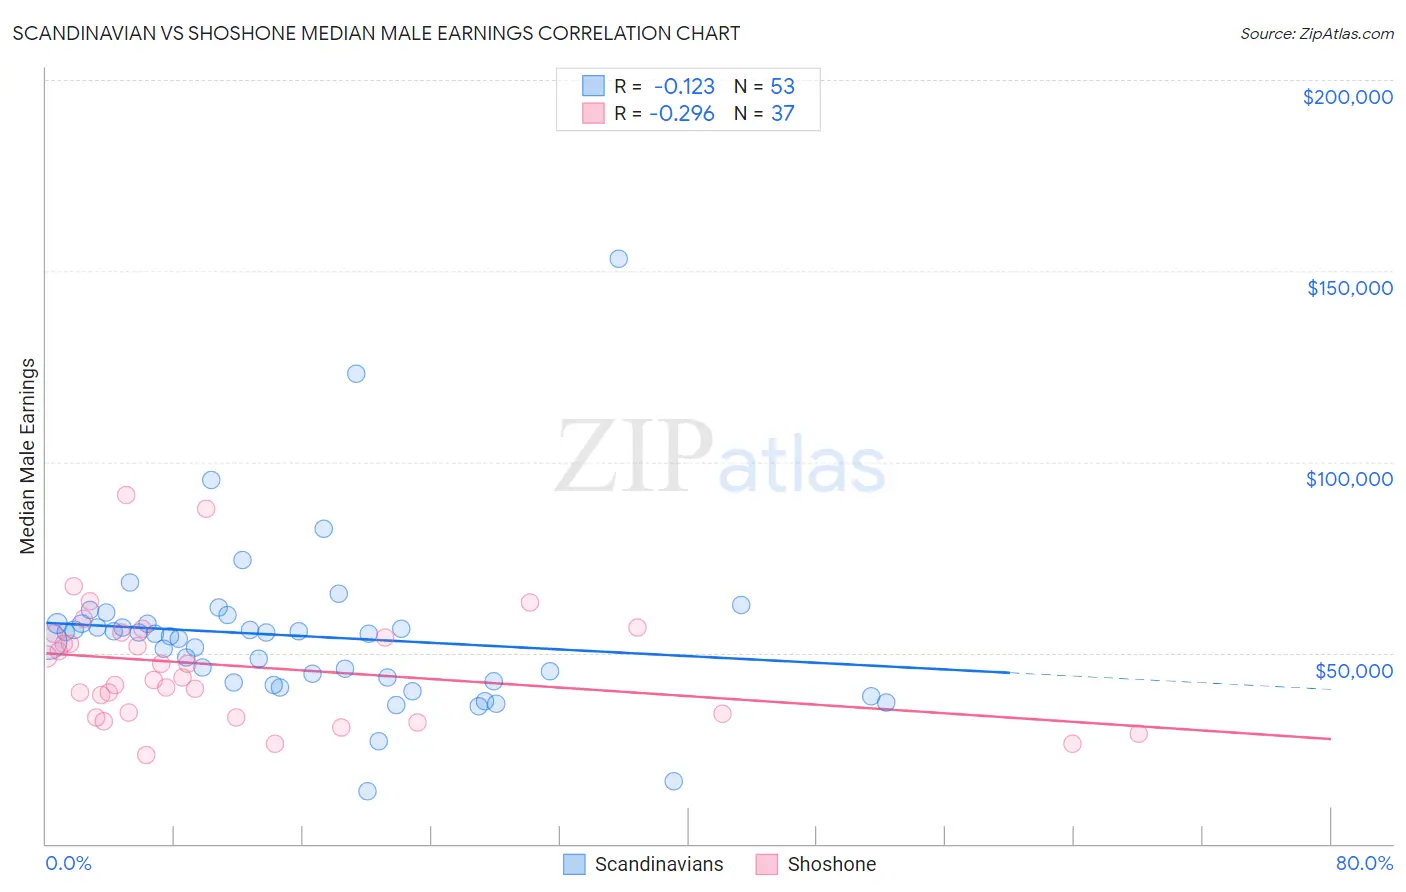
Scandinavian vs Shoshone Median Male Earnings Correlation Chart
The statistical analysis conducted on geographies consisting of 472,245,233 people shows a poor negative correlation between the proportion of Scandinavians and median male earnings in the United States with a correlation coefficient (R) of -0.123 and weighted average of $55,527. Similarly, the statistical analysis conducted on geographies consisting of 66,614,721 people shows a weak negative correlation between the proportion of Shoshone and median male earnings in the United States with a correlation coefficient (R) of -0.296 and weighted average of $47,930, a difference of 15.9%.
Median Male Earnings Correlation Summary
| Measurement | Scandinavian | Shoshone |
| Minimum | $13,865 | $23,214 |
| Maximum | $153,203 | $91,250 |
| Range | $139,338 | $68,036 |
| Mean | $54,403 | $46,471 |
| Median | $55,045 | $43,516 |
| Interquartile 25% (IQ1) | $42,380 | $33,573 |
| Interquartile 75% (IQ3) | $57,674 | $55,141 |
| Interquartile Range (IQR) | $15,293 | $21,568 |
| Standard Deviation (Sample) | $21,926 | $15,536 |
| Standard Deviation (Population) | $21,718 | $15,324 |
Similar Demographics by Median Male Earnings
Demographics Similar to Scandinavians by Median Male Earnings
In terms of median male earnings, the demographic groups most similar to Scandinavians are Taiwanese ($55,556, a difference of 0.050%), Immigrants from Nepal ($55,615, a difference of 0.16%), Immigrants from Ethiopia ($55,434, a difference of 0.17%), Icelander ($55,415, a difference of 0.20%), and Peruvian ($55,659, a difference of 0.24%).
| Demographics | Rating | Rank | Median Male Earnings |
| Scottish | 78.2 /100 | #148 | Good $55,793 |
| English | 77.4 /100 | #149 | Good $55,747 |
| Swiss | 77.1 /100 | #150 | Good $55,731 |
| Immigrants | Oceania | 76.8 /100 | #151 | Good $55,712 |
| Peruvians | 75.8 /100 | #152 | Good $55,659 |
| Immigrants | Nepal | 75.0 /100 | #153 | Good $55,615 |
| Taiwanese | 73.9 /100 | #154 | Good $55,556 |
| Scandinavians | 73.4 /100 | #155 | Good $55,527 |
| Immigrants | Ethiopia | 71.6 /100 | #156 | Good $55,434 |
| Icelanders | 71.2 /100 | #157 | Good $55,415 |
| Czechoslovakians | 70.5 /100 | #158 | Good $55,382 |
| Alsatians | 70.5 /100 | #159 | Good $55,380 |
| Basques | 70.3 /100 | #160 | Good $55,370 |
| Belgians | 70.1 /100 | #161 | Good $55,361 |
| French | 69.9 /100 | #162 | Good $55,350 |
Demographics Similar to Shoshone by Median Male Earnings
In terms of median male earnings, the demographic groups most similar to Shoshone are Immigrants from El Salvador ($47,973, a difference of 0.090%), Mexican American Indian ($47,990, a difference of 0.12%), African ($47,994, a difference of 0.13%), Paiute ($47,991, a difference of 0.13%), and Chickasaw ($47,832, a difference of 0.21%).
| Demographics | Rating | Rank | Median Male Earnings |
| Marshallese | 0.2 /100 | #281 | Tragic $48,137 |
| Central Americans | 0.2 /100 | #282 | Tragic $48,093 |
| Immigrants | Jamaica | 0.2 /100 | #283 | Tragic $48,040 |
| Africans | 0.2 /100 | #284 | Tragic $47,994 |
| Paiute | 0.2 /100 | #285 | Tragic $47,991 |
| Mexican American Indians | 0.2 /100 | #286 | Tragic $47,990 |
| Immigrants | El Salvador | 0.2 /100 | #287 | Tragic $47,973 |
| Shoshone | 0.2 /100 | #288 | Tragic $47,930 |
| Chickasaw | 0.1 /100 | #289 | Tragic $47,832 |
| Immigrants | Belize | 0.1 /100 | #290 | Tragic $47,809 |
| Choctaw | 0.1 /100 | #291 | Tragic $47,729 |
| Immigrants | Dominica | 0.1 /100 | #292 | Tragic $47,651 |
| Indonesians | 0.1 /100 | #293 | Tragic $47,503 |
| Immigrants | Nicaragua | 0.1 /100 | #294 | Tragic $47,482 |
| Central American Indians | 0.1 /100 | #295 | Tragic $47,433 |