Scandinavian vs Immigrants from Australia Median Male Earnings
COMPARE
Scandinavian
Immigrants from Australia
Median Male Earnings
Median Male Earnings Comparison
Scandinavians
Immigrants from Australia
$55,527
MEDIAN MALE EARNINGS
73.4/ 100
METRIC RATING
155th/ 347
METRIC RANK
$67,634
MEDIAN MALE EARNINGS
100.0/ 100
METRIC RATING
12th/ 347
METRIC RANK
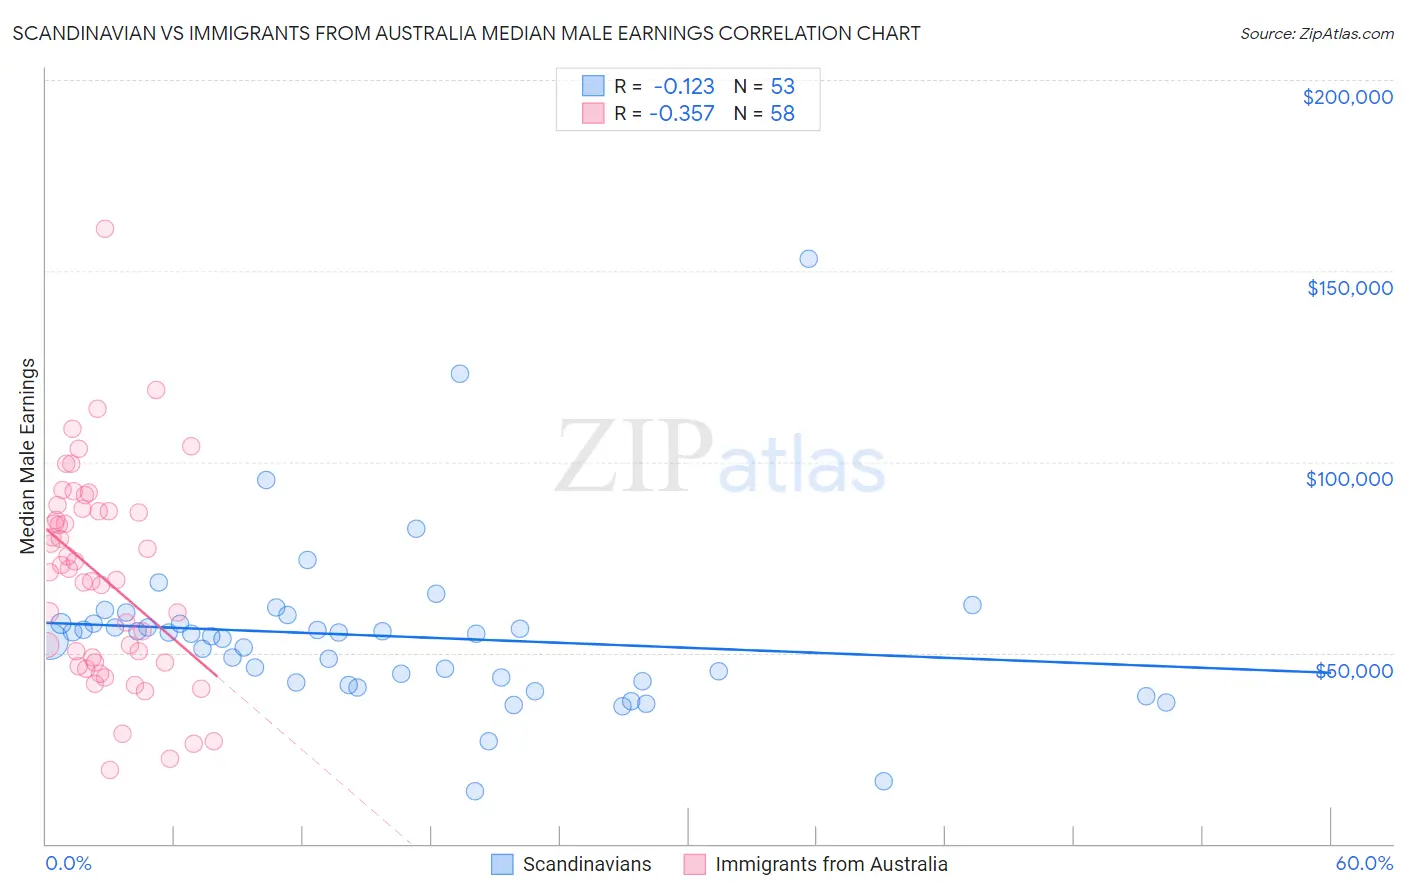
Scandinavian vs Immigrants from Australia Median Male Earnings Correlation Chart
The statistical analysis conducted on geographies consisting of 472,245,233 people shows a poor negative correlation between the proportion of Scandinavians and median male earnings in the United States with a correlation coefficient (R) of -0.123 and weighted average of $55,527. Similarly, the statistical analysis conducted on geographies consisting of 227,162,363 people shows a mild negative correlation between the proportion of Immigrants from Australia and median male earnings in the United States with a correlation coefficient (R) of -0.357 and weighted average of $67,634, a difference of 21.8%.
Median Male Earnings Correlation Summary
| Measurement | Scandinavian | Immigrants from Australia |
| Minimum | $13,865 | $19,341 |
| Maximum | $153,203 | $160,989 |
| Range | $139,338 | $141,648 |
| Mean | $54,403 | $69,957 |
| Median | $55,045 | $71,553 |
| Interquartile 25% (IQ1) | $42,380 | $47,501 |
| Interquartile 75% (IQ3) | $57,674 | $87,155 |
| Interquartile Range (IQR) | $15,293 | $39,654 |
| Standard Deviation (Sample) | $21,926 | $27,266 |
| Standard Deviation (Population) | $21,718 | $27,029 |
Similar Demographics by Median Male Earnings
Demographics Similar to Scandinavians by Median Male Earnings
In terms of median male earnings, the demographic groups most similar to Scandinavians are Taiwanese ($55,556, a difference of 0.050%), Immigrants from Nepal ($55,615, a difference of 0.16%), Immigrants from Ethiopia ($55,434, a difference of 0.17%), Icelander ($55,415, a difference of 0.20%), and Peruvian ($55,659, a difference of 0.24%).
| Demographics | Rating | Rank | Median Male Earnings |
| Scottish | 78.2 /100 | #148 | Good $55,793 |
| English | 77.4 /100 | #149 | Good $55,747 |
| Swiss | 77.1 /100 | #150 | Good $55,731 |
| Immigrants | Oceania | 76.8 /100 | #151 | Good $55,712 |
| Peruvians | 75.8 /100 | #152 | Good $55,659 |
| Immigrants | Nepal | 75.0 /100 | #153 | Good $55,615 |
| Taiwanese | 73.9 /100 | #154 | Good $55,556 |
| Scandinavians | 73.4 /100 | #155 | Good $55,527 |
| Immigrants | Ethiopia | 71.6 /100 | #156 | Good $55,434 |
| Icelanders | 71.2 /100 | #157 | Good $55,415 |
| Czechoslovakians | 70.5 /100 | #158 | Good $55,382 |
| Alsatians | 70.5 /100 | #159 | Good $55,380 |
| Basques | 70.3 /100 | #160 | Good $55,370 |
| Belgians | 70.1 /100 | #161 | Good $55,361 |
| French | 69.9 /100 | #162 | Good $55,350 |
Demographics Similar to Immigrants from Australia by Median Male Earnings
In terms of median male earnings, the demographic groups most similar to Immigrants from Australia are Immigrants from Ireland ($67,698, a difference of 0.090%), Immigrants from China ($67,353, a difference of 0.42%), Okinawan ($67,232, a difference of 0.60%), Immigrants from Eastern Asia ($66,903, a difference of 1.1%), and Immigrants from Israel ($68,716, a difference of 1.6%).
| Demographics | Rating | Rank | Median Male Earnings |
| Immigrants | Singapore | 100.0 /100 | #5 | Exceptional $71,348 |
| Iranians | 100.0 /100 | #6 | Exceptional $70,648 |
| Immigrants | Hong Kong | 100.0 /100 | #7 | Exceptional $70,146 |
| Immigrants | Iran | 100.0 /100 | #8 | Exceptional $69,284 |
| Immigrants | South Central Asia | 100.0 /100 | #9 | Exceptional $68,960 |
| Immigrants | Israel | 100.0 /100 | #10 | Exceptional $68,716 |
| Immigrants | Ireland | 100.0 /100 | #11 | Exceptional $67,698 |
| Immigrants | Australia | 100.0 /100 | #12 | Exceptional $67,634 |
| Immigrants | China | 100.0 /100 | #13 | Exceptional $67,353 |
| Okinawans | 100.0 /100 | #14 | Exceptional $67,232 |
| Immigrants | Eastern Asia | 100.0 /100 | #15 | Exceptional $66,903 |
| Eastern Europeans | 100.0 /100 | #16 | Exceptional $66,472 |
| Immigrants | Belgium | 100.0 /100 | #17 | Exceptional $66,125 |
| Indians (Asian) | 100.0 /100 | #18 | Exceptional $66,078 |
| Cypriots | 100.0 /100 | #19 | Exceptional $65,549 |