Scandinavian vs Immigrants from Czechoslovakia Median Male Earnings
COMPARE
Scandinavian
Immigrants from Czechoslovakia
Median Male Earnings
Median Male Earnings Comparison
Scandinavians
Immigrants from Czechoslovakia
$55,527
MEDIAN MALE EARNINGS
73.4/ 100
METRIC RATING
155th/ 347
METRIC RANK
$62,217
MEDIAN MALE EARNINGS
99.9/ 100
METRIC RATING
46th/ 347
METRIC RANK
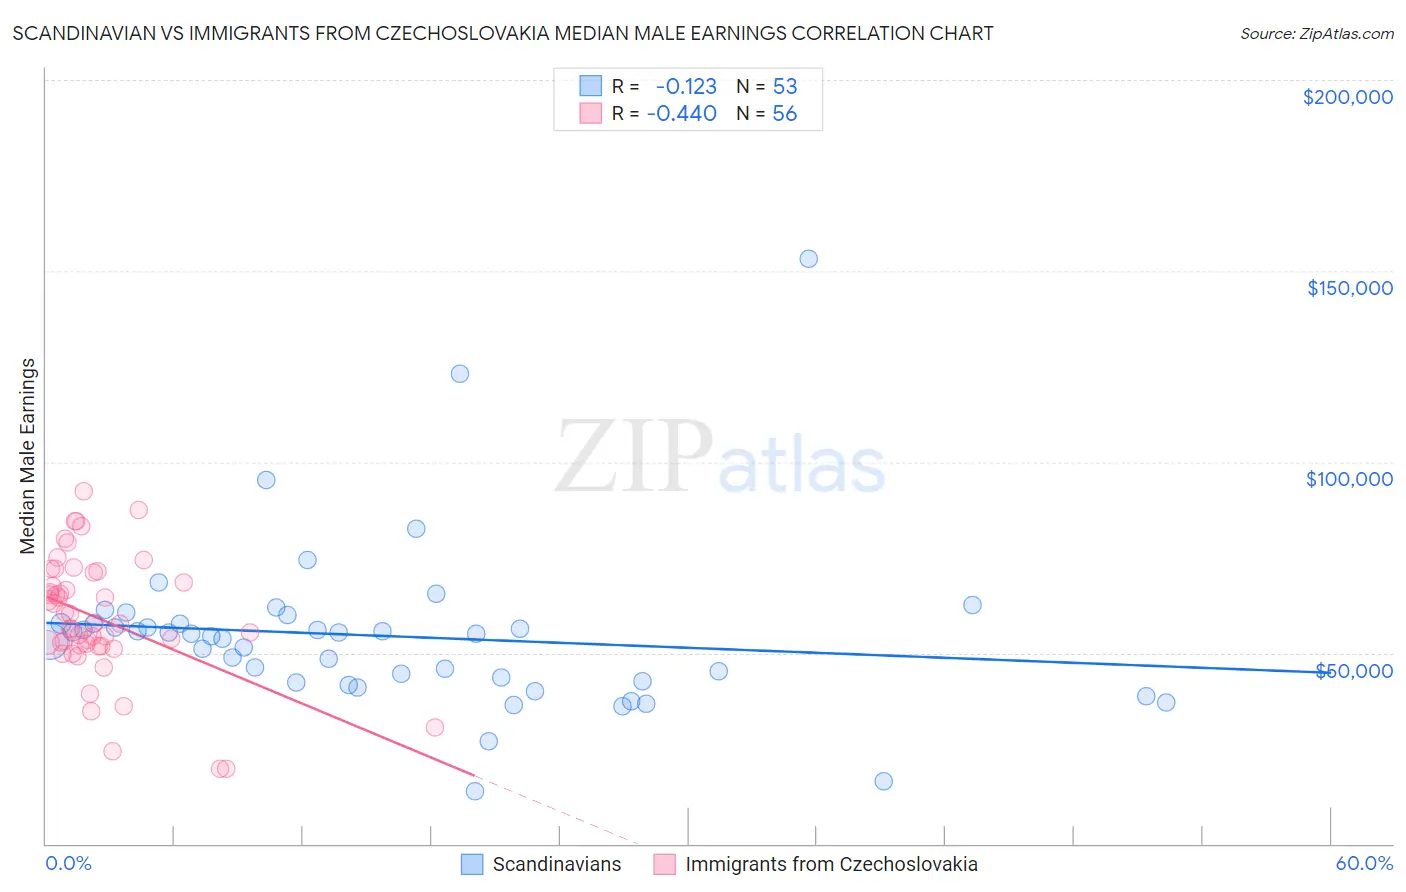
Scandinavian vs Immigrants from Czechoslovakia Median Male Earnings Correlation Chart
The statistical analysis conducted on geographies consisting of 472,245,233 people shows a poor negative correlation between the proportion of Scandinavians and median male earnings in the United States with a correlation coefficient (R) of -0.123 and weighted average of $55,527. Similarly, the statistical analysis conducted on geographies consisting of 195,431,341 people shows a moderate negative correlation between the proportion of Immigrants from Czechoslovakia and median male earnings in the United States with a correlation coefficient (R) of -0.440 and weighted average of $62,217, a difference of 12.0%.
Median Male Earnings Correlation Summary
| Measurement | Scandinavian | Immigrants from Czechoslovakia |
| Minimum | $13,865 | $19,792 |
| Maximum | $153,203 | $92,305 |
| Range | $139,338 | $72,513 |
| Mean | $54,403 | $59,087 |
| Median | $55,045 | $57,746 |
| Interquartile 25% (IQ1) | $42,380 | $51,971 |
| Interquartile 75% (IQ3) | $57,674 | $69,695 |
| Interquartile Range (IQR) | $15,293 | $17,724 |
| Standard Deviation (Sample) | $21,926 | $15,934 |
| Standard Deviation (Population) | $21,718 | $15,791 |
Similar Demographics by Median Male Earnings
Demographics Similar to Scandinavians by Median Male Earnings
In terms of median male earnings, the demographic groups most similar to Scandinavians are Taiwanese ($55,556, a difference of 0.050%), Immigrants from Nepal ($55,615, a difference of 0.16%), Immigrants from Ethiopia ($55,434, a difference of 0.17%), Icelander ($55,415, a difference of 0.20%), and Peruvian ($55,659, a difference of 0.24%).
| Demographics | Rating | Rank | Median Male Earnings |
| Scottish | 78.2 /100 | #148 | Good $55,793 |
| English | 77.4 /100 | #149 | Good $55,747 |
| Swiss | 77.1 /100 | #150 | Good $55,731 |
| Immigrants | Oceania | 76.8 /100 | #151 | Good $55,712 |
| Peruvians | 75.8 /100 | #152 | Good $55,659 |
| Immigrants | Nepal | 75.0 /100 | #153 | Good $55,615 |
| Taiwanese | 73.9 /100 | #154 | Good $55,556 |
| Scandinavians | 73.4 /100 | #155 | Good $55,527 |
| Immigrants | Ethiopia | 71.6 /100 | #156 | Good $55,434 |
| Icelanders | 71.2 /100 | #157 | Good $55,415 |
| Czechoslovakians | 70.5 /100 | #158 | Good $55,382 |
| Alsatians | 70.5 /100 | #159 | Good $55,380 |
| Basques | 70.3 /100 | #160 | Good $55,370 |
| Belgians | 70.1 /100 | #161 | Good $55,361 |
| French | 69.9 /100 | #162 | Good $55,350 |
Demographics Similar to Immigrants from Czechoslovakia by Median Male Earnings
In terms of median male earnings, the demographic groups most similar to Immigrants from Czechoslovakia are Immigrants from Austria ($62,164, a difference of 0.090%), Immigrants from Malaysia ($62,121, a difference of 0.15%), Bulgarian ($62,378, a difference of 0.26%), Immigrants from Europe ($62,057, a difference of 0.26%), and Cambodian ($62,516, a difference of 0.48%).
| Demographics | Rating | Rank | Median Male Earnings |
| Immigrants | South Africa | 100.0 /100 | #39 | Exceptional $62,899 |
| Australians | 100.0 /100 | #40 | Exceptional $62,857 |
| Immigrants | Turkey | 100.0 /100 | #41 | Exceptional $62,728 |
| Immigrants | Greece | 100.0 /100 | #42 | Exceptional $62,689 |
| Immigrants | Belarus | 100.0 /100 | #43 | Exceptional $62,658 |
| Cambodians | 100.0 /100 | #44 | Exceptional $62,516 |
| Bulgarians | 100.0 /100 | #45 | Exceptional $62,378 |
| Immigrants | Czechoslovakia | 99.9 /100 | #46 | Exceptional $62,217 |
| Immigrants | Austria | 99.9 /100 | #47 | Exceptional $62,164 |
| Immigrants | Malaysia | 99.9 /100 | #48 | Exceptional $62,121 |
| Immigrants | Europe | 99.9 /100 | #49 | Exceptional $62,057 |
| Bhutanese | 99.9 /100 | #50 | Exceptional $61,759 |
| Estonians | 99.9 /100 | #51 | Exceptional $61,710 |
| Immigrants | Norway | 99.9 /100 | #52 | Exceptional $61,628 |
| South Africans | 99.9 /100 | #53 | Exceptional $61,460 |