Salvadoran vs Immigrants from Mexico Householder Income Ages 45 - 64 years
COMPARE
Salvadoran
Immigrants from Mexico
Householder Income Ages 45 - 64 years
Householder Income Ages 45 - 64 years Comparison
Salvadorans
Immigrants from Mexico
$94,842
HOUSEHOLDER INCOME AGES 45 - 64 YEARS
6.0/ 100
METRIC RATING
220th/ 347
METRIC RANK
$84,910
HOUSEHOLDER INCOME AGES 45 - 64 YEARS
0.0/ 100
METRIC RATING
299th/ 347
METRIC RANK
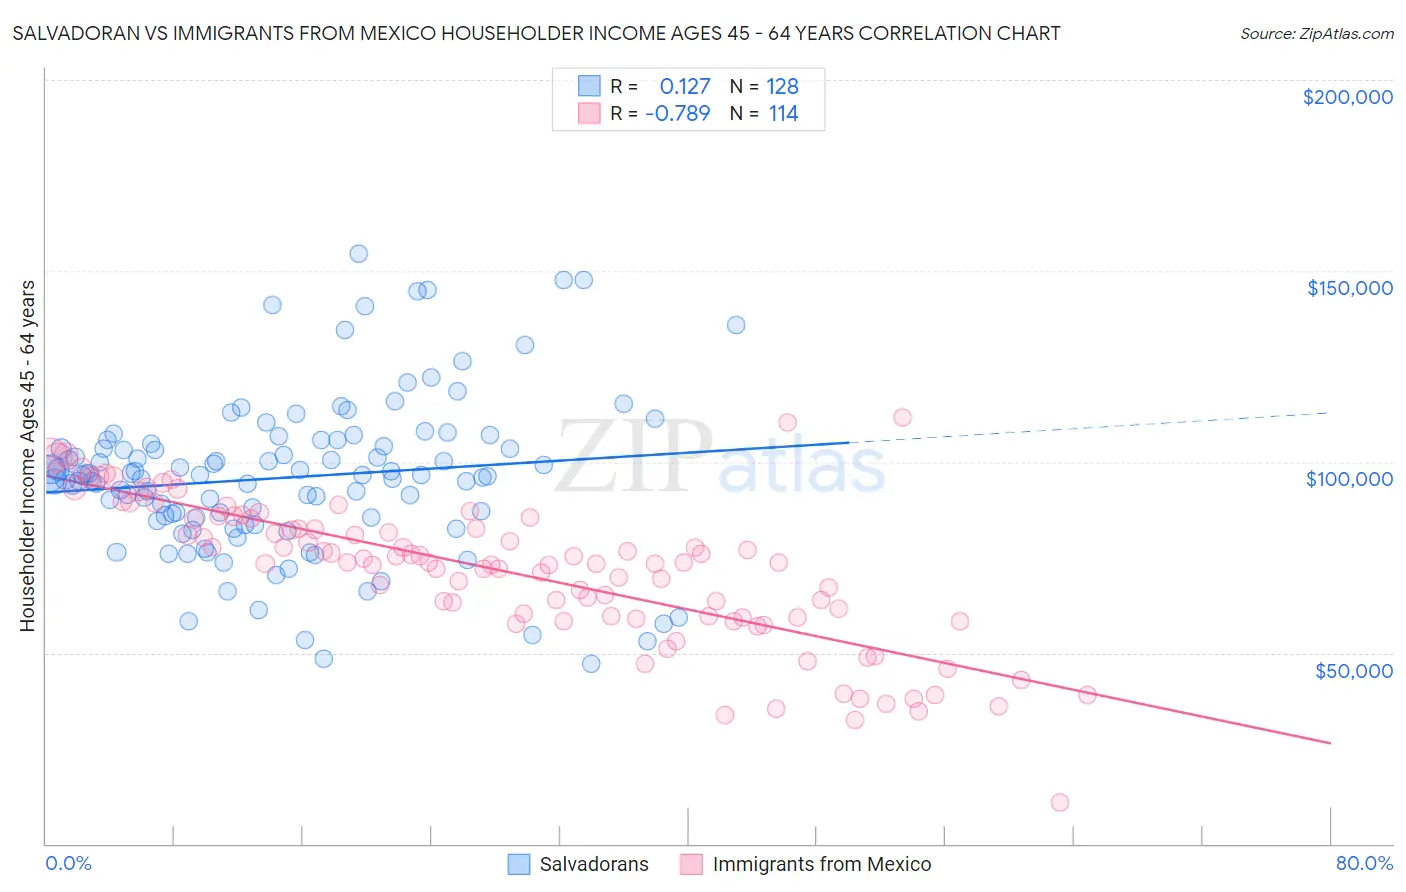
Salvadoran vs Immigrants from Mexico Householder Income Ages 45 - 64 years Correlation Chart
The statistical analysis conducted on geographies consisting of 398,191,339 people shows a poor positive correlation between the proportion of Salvadorans and household income with householder between the ages 45 and 64 in the United States with a correlation coefficient (R) of 0.127 and weighted average of $94,842. Similarly, the statistical analysis conducted on geographies consisting of 511,517,023 people shows a strong negative correlation between the proportion of Immigrants from Mexico and household income with householder between the ages 45 and 64 in the United States with a correlation coefficient (R) of -0.789 and weighted average of $84,910, a difference of 11.7%.
Householder Income Ages 45 - 64 years Correlation Summary
| Measurement | Salvadoran | Immigrants from Mexico |
| Minimum | $47,083 | $10,788 |
| Maximum | $154,565 | $111,667 |
| Range | $107,482 | $100,879 |
| Mean | $95,925 | $71,096 |
| Median | $96,593 | $73,588 |
| Interquartile 25% (IQ1) | $84,940 | $59,284 |
| Interquartile 75% (IQ3) | $105,324 | $85,004 |
| Interquartile Range (IQR) | $20,384 | $25,720 |
| Standard Deviation (Sample) | $20,754 | $18,984 |
| Standard Deviation (Population) | $20,673 | $18,900 |
Similar Demographics by Householder Income Ages 45 - 64 years
Demographics Similar to Salvadorans by Householder Income Ages 45 - 64 years
In terms of householder income ages 45 - 64 years, the demographic groups most similar to Salvadorans are Immigrants from Armenia ($94,863, a difference of 0.020%), Immigrants from Nigeria ($94,804, a difference of 0.040%), Delaware ($94,914, a difference of 0.080%), Immigrants from Ghana ($94,982, a difference of 0.15%), and Malaysian ($94,517, a difference of 0.34%).
| Demographics | Rating | Rank | Householder Income Ages 45 - 64 years |
| Immigrants | Uruguay | 10.7 /100 | #213 | Poor $96,086 |
| Panamanians | 10.6 /100 | #214 | Poor $96,066 |
| Nigerians | 8.2 /100 | #215 | Tragic $95,492 |
| Immigrants | Venezuela | 7.6 /100 | #216 | Tragic $95,342 |
| Immigrants | Ghana | 6.4 /100 | #217 | Tragic $94,982 |
| Delaware | 6.2 /100 | #218 | Tragic $94,914 |
| Immigrants | Armenia | 6.1 /100 | #219 | Tragic $94,863 |
| Salvadorans | 6.0 /100 | #220 | Tragic $94,842 |
| Immigrants | Nigeria | 5.9 /100 | #221 | Tragic $94,804 |
| Malaysians | 5.2 /100 | #222 | Tragic $94,517 |
| Immigrants | Nonimmigrants | 5.0 /100 | #223 | Tragic $94,448 |
| Immigrants | Bosnia and Herzegovina | 4.6 /100 | #224 | Tragic $94,288 |
| Bermudans | 4.4 /100 | #225 | Tragic $94,197 |
| Immigrants | Azores | 4.3 /100 | #226 | Tragic $94,138 |
| Alaska Natives | 4.0 /100 | #227 | Tragic $93,991 |
Demographics Similar to Immigrants from Mexico by Householder Income Ages 45 - 64 years
In terms of householder income ages 45 - 64 years, the demographic groups most similar to Immigrants from Mexico are African ($84,925, a difference of 0.020%), Indonesian ($84,890, a difference of 0.020%), Fijian ($85,187, a difference of 0.33%), Immigrants from Zaire ($85,207, a difference of 0.35%), and Potawatomi ($84,613, a difference of 0.35%).
| Demographics | Rating | Rank | Householder Income Ages 45 - 64 years |
| Immigrants | Central America | 0.1 /100 | #292 | Tragic $85,965 |
| Comanche | 0.1 /100 | #293 | Tragic $85,787 |
| British West Indians | 0.1 /100 | #294 | Tragic $85,571 |
| Immigrants | Grenada | 0.1 /100 | #295 | Tragic $85,552 |
| Immigrants | Zaire | 0.1 /100 | #296 | Tragic $85,207 |
| Fijians | 0.1 /100 | #297 | Tragic $85,187 |
| Africans | 0.0 /100 | #298 | Tragic $84,925 |
| Immigrants | Mexico | 0.0 /100 | #299 | Tragic $84,910 |
| Indonesians | 0.0 /100 | #300 | Tragic $84,890 |
| Potawatomi | 0.0 /100 | #301 | Tragic $84,613 |
| Haitians | 0.0 /100 | #302 | Tragic $84,384 |
| Hondurans | 0.0 /100 | #303 | Tragic $84,079 |
| Ottawa | 0.0 /100 | #304 | Tragic $83,953 |
| Chippewa | 0.0 /100 | #305 | Tragic $83,943 |
| Ute | 0.0 /100 | #306 | Tragic $83,937 |