Salvadoran vs Immigrants from Japan Median Household Income
COMPARE
Salvadoran
Immigrants from Japan
Median Household Income
Median Household Income Comparison
Salvadorans
Immigrants from Japan
$82,449
MEDIAN HOUSEHOLD INCOME
15.4/ 100
METRIC RATING
211th/ 347
METRIC RANK
$100,711
MEDIAN HOUSEHOLD INCOME
100.0/ 100
METRIC RATING
24th/ 347
METRIC RANK
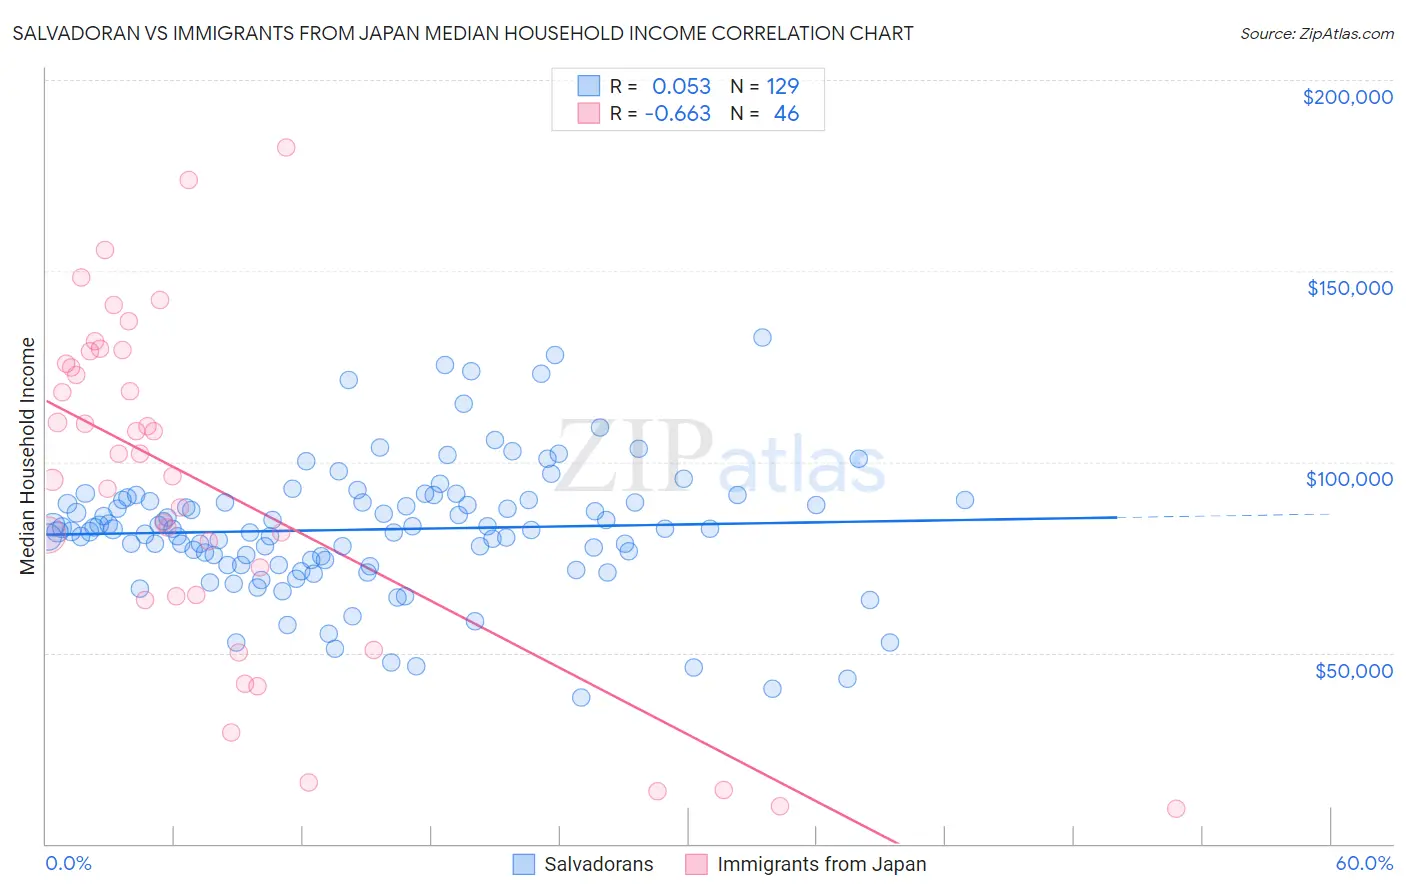
Salvadoran vs Immigrants from Japan Median Household Income Correlation Chart
The statistical analysis conducted on geographies consisting of 398,609,851 people shows a slight positive correlation between the proportion of Salvadorans and median household income in the United States with a correlation coefficient (R) of 0.053 and weighted average of $82,449. Similarly, the statistical analysis conducted on geographies consisting of 339,951,010 people shows a significant negative correlation between the proportion of Immigrants from Japan and median household income in the United States with a correlation coefficient (R) of -0.663 and weighted average of $100,711, a difference of 22.2%.
Median Household Income Correlation Summary
| Measurement | Salvadoran | Immigrants from Japan |
| Minimum | $38,281 | $9,145 |
| Maximum | $132,625 | $182,188 |
| Range | $94,344 | $173,043 |
| Mean | $82,302 | $93,083 |
| Median | $82,350 | $99,144 |
| Interquartile 25% (IQ1) | $73,617 | $64,688 |
| Interquartile 75% (IQ3) | $90,029 | $125,805 |
| Interquartile Range (IQR) | $16,412 | $61,117 |
| Standard Deviation (Sample) | $17,071 | $44,275 |
| Standard Deviation (Population) | $17,005 | $43,791 |
Similar Demographics by Median Household Income
Demographics Similar to Salvadorans by Median Household Income
In terms of median household income, the demographic groups most similar to Salvadorans are Venezuelan ($82,432, a difference of 0.020%), Nepalese ($82,410, a difference of 0.050%), Immigrants from Uruguay ($82,560, a difference of 0.14%), Immigrants from Iraq ($82,594, a difference of 0.18%), and Panamanian ($82,272, a difference of 0.22%).
| Demographics | Rating | Rank | Median Household Income |
| Immigrants | Africa | 23.8 /100 | #204 | Fair $83,289 |
| Celtics | 22.7 /100 | #205 | Fair $83,193 |
| Immigrants | Kenya | 21.3 /100 | #206 | Fair $83,068 |
| Dutch | 20.3 /100 | #207 | Fair $82,971 |
| French Canadians | 18.7 /100 | #208 | Poor $82,810 |
| Immigrants | Iraq | 16.7 /100 | #209 | Poor $82,594 |
| Immigrants | Uruguay | 16.4 /100 | #210 | Poor $82,560 |
| Salvadorans | 15.4 /100 | #211 | Poor $82,449 |
| Venezuelans | 15.3 /100 | #212 | Poor $82,432 |
| Nepalese | 15.1 /100 | #213 | Poor $82,410 |
| Panamanians | 14.0 /100 | #214 | Poor $82,272 |
| Vietnamese | 13.8 /100 | #215 | Poor $82,248 |
| Yugoslavians | 13.3 /100 | #216 | Poor $82,186 |
| Ecuadorians | 12.5 /100 | #217 | Poor $82,070 |
| Whites/Caucasians | 12.2 /100 | #218 | Poor $82,029 |
Demographics Similar to Immigrants from Japan by Median Household Income
In terms of median household income, the demographic groups most similar to Immigrants from Japan are Immigrants from Sweden ($100,699, a difference of 0.010%), Immigrants from Belgium ($100,306, a difference of 0.40%), Bhutanese ($100,151, a difference of 0.56%), Immigrants from Bolivia ($101,394, a difference of 0.68%), and Immigrants from Sri Lanka ($99,943, a difference of 0.77%).
| Demographics | Rating | Rank | Median Household Income |
| Immigrants | Korea | 100.0 /100 | #17 | Exceptional $102,962 |
| Cypriots | 100.0 /100 | #18 | Exceptional $102,843 |
| Immigrants | Australia | 100.0 /100 | #19 | Exceptional $102,562 |
| Bolivians | 100.0 /100 | #20 | Exceptional $102,195 |
| Eastern Europeans | 100.0 /100 | #21 | Exceptional $101,781 |
| Asians | 100.0 /100 | #22 | Exceptional $101,681 |
| Immigrants | Bolivia | 100.0 /100 | #23 | Exceptional $101,394 |
| Immigrants | Japan | 100.0 /100 | #24 | Exceptional $100,711 |
| Immigrants | Sweden | 100.0 /100 | #25 | Exceptional $100,699 |
| Immigrants | Belgium | 100.0 /100 | #26 | Exceptional $100,306 |
| Bhutanese | 100.0 /100 | #27 | Exceptional $100,151 |
| Immigrants | Sri Lanka | 100.0 /100 | #28 | Exceptional $99,943 |
| Immigrants | Asia | 100.0 /100 | #29 | Exceptional $99,933 |
| Immigrants | Northern Europe | 100.0 /100 | #30 | Exceptional $99,813 |
| Turks | 100.0 /100 | #31 | Exceptional $99,389 |